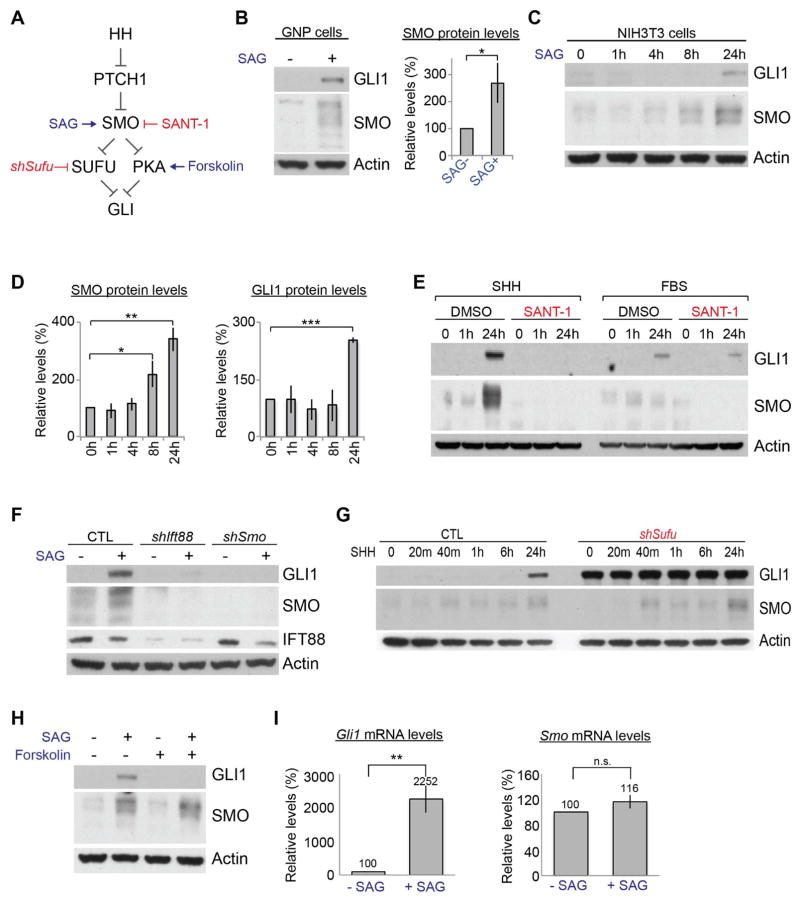
Figure 3. HH signaling increases SMO protein levels via a noncanonical pathway.
(A) Schematic showing a simplified HH signaling pathway with reagents used to modulate the signaling. (B) SAG increased GLI1 and SMO protein levels in GNPs in culture within 24 h. The bars show the fold changes in the SMO levels relative to those in untreated cells (SAG−) (mean ± SD, n=3). (C, D) Western blots and quantifications of GLI1 and SMO protein levels in NIH 3T3 cells at the indicated times after SHH treatment. The bars show the fold changes in the protein levels relative to those in untreated cells (mean ± SD, n=3). (E) SMO and GLI1 protein levels in NIH 3T3 cells stimulated with SHH or FBS in the presence or absence of SANT-1. (F) SAG-induced GLI1 and SMO protein levels in NIH 3T3 cells were suppressed in cells expressing shRNA against Ift88 (shIft88) or Smo (shSmo). (G) GLI1 and SMO protein levels in NIH 3T3 cells expressing shSufu at the indicated times after SHH treatment. Note that SMO, but not GLI1, was induced by SHH. (H) Forskolin blocked SAG from increasing GLI1 but not SMO protein levels. (I) SAG increased Gli1 but not Smo mRNA levels in NIH 3T3 cells. The bars show the fold changes in the mRNA levels relative to those in untreated cells (mean ± SD, n=3). *P < 0.05; ** P < 0.01; *** P < 0.005; n.s., P > 0.05.

