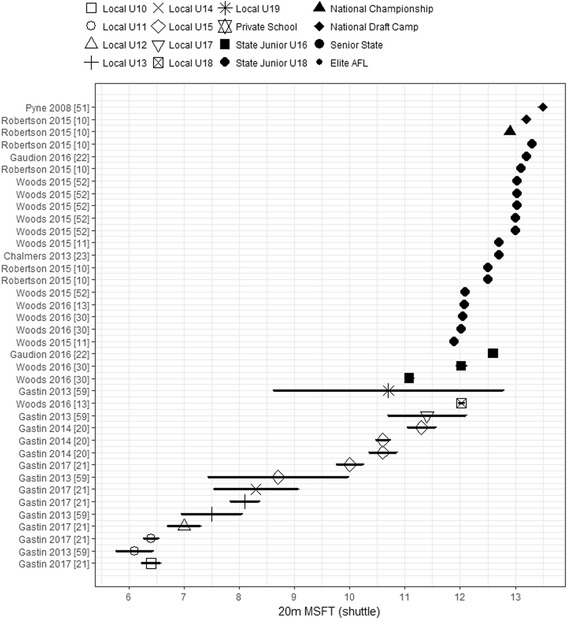
Fig. 6.

Mean and CIs of 20-m MSFT shuttles reached by levels across the local participation and talent pathways. Values are ordered by position in AFL participation pathway, then by sample size reported for each group. All players’ levels are shown in the legend for consistency though not all levels may have data on the charted performance measure. AFL Australian Football League, MSFT multi-stage fitness test, U Under
