FIGURE 3.
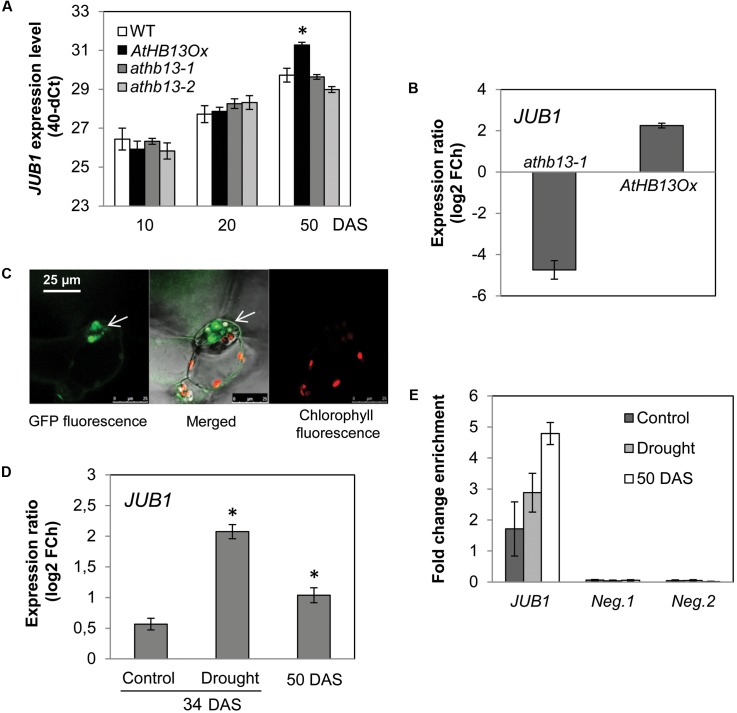
AtHB13 directly regulates JUB1. (A) Expression of JUB1 in 10-, 20-, and 50-day-old WT, AtHB13Ox, and athb13-1 and athb13-2 plants in well-watered condition. Transcript levels were determined by qRT-PCR; values are expressed as the difference between an arbitrary value of 40 and dCt, so that high 40-dCt value indicates high gene expression level. Means ± SD calculated from three independent biological experiments (each with nine leaves pooled from three plants). Expression levels were normalized against the expression level of ACTIN2. DAS, days after sowing. Asterisk indicates statistically significant difference (Student’s t-test (∗p < 0.05) from WT. (B) Expression of JUB1 in 35S:AtHB13 (AtHB13Ox) and athb13-1 plants compared to WT upon drought treatment. For drought treatment, 4-week-old plants were subjected to water withholding for 6 days. Whole rosettes of drought-treated and well-watered (control) plants were harvested for gene expression analysis by qRT-PCR. Data represent the means of three biological repetitions ± SD. FCh, fold change. (C) Confocal microscope image showing nuclear localization of the AtHB13-GFP fusion protein in transgenic 35S:AtHB13-GFP Arabidopsis plants. Left, GFP signal; middle, chlorophyll autofluorescence merged with GFP fluorescence; right, chlorophyll autofluorescence. (D) Expression of JUB1 in 35S:AtHB13-GFP plants compared to WT upon drought stress and at a later stage of development (50-day-old plants). For drought treatment, 4-week-old plants were subjected to drought by withholding water for 6 days. Whole rosettes of drought-treated and well-watered (control) plants were harvested for gene expression analysis by qRT-PCR. Data represent the means of three biological repetitions ± SD. FCh, fold change. Asterisks indicate statistically significant difference (p < 0.01; Student’s t-test) from the non-stress control at 34 DAS. (E) ChIP-qPCR showing enrichment of the JUB1 promoter region containing the HD-Zip I binding site, quantified by qPCR. For the ChIP experiment rosettes of 35S:AtHB13-GFP and WT plants were harvested as follows: from 4-week-old control plants (well watered; ‘control’); from plants grown for 4 weeks in well-watered condition and then subjected for 6 d to drought stress by withholding water (‘drought’); and from 50-day-old plants grown under well-watered condition (‘50 DAS’). As negative controls, primers annealing to promoter regions of two Arabidopsis genes lacking an HD-Zip I binding site, i.e., AT3G18040 (Neg. 1) and AT2G22180 (Neg. 2), were used. Data represent the means of three biological repetitions ± SD.

