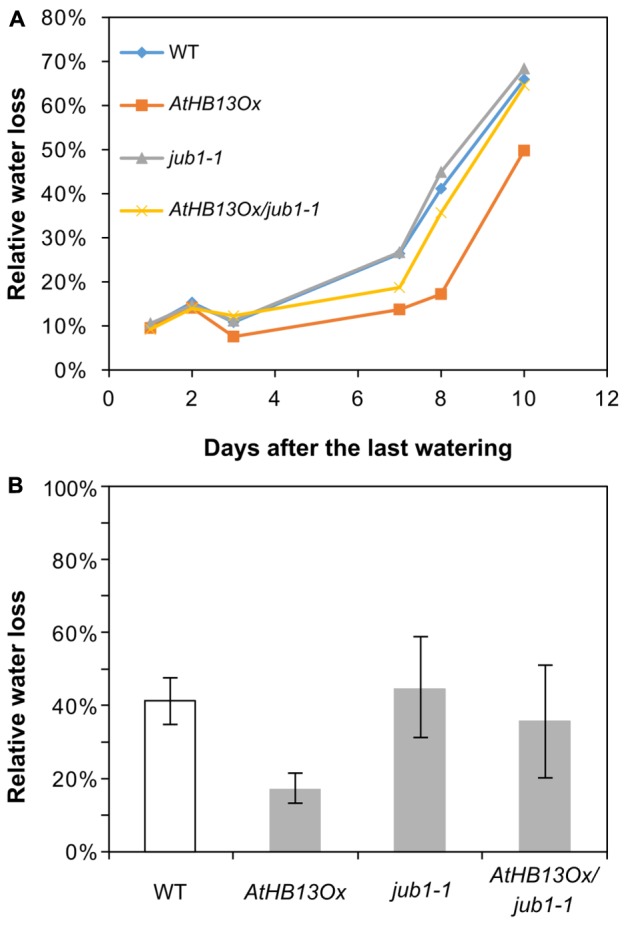
FIGURE 4.

AtHB13Ox/jub1-1 plants behave similar to jub1-1 plants during drought stress. (A) Kinetics of relative water loss of leaves form WT, AtHB13Ox, jub1-1, and AtHB13Ox/jub1-1 plants. Plants were grown under well-watered condition for 20 days; thereafter, irrigation was stopped, gradually leading to severe drought stress. (B) Relative water loss in leaves during 9 days of the treatment. For each genotype, leaves from five plants (one leaf per plant) were analyzed. Bars represent SD. The asterisk indicates significant difference from AtHB13Ox/jub1-1 plants (Student’s t-test, p < 0.05).
