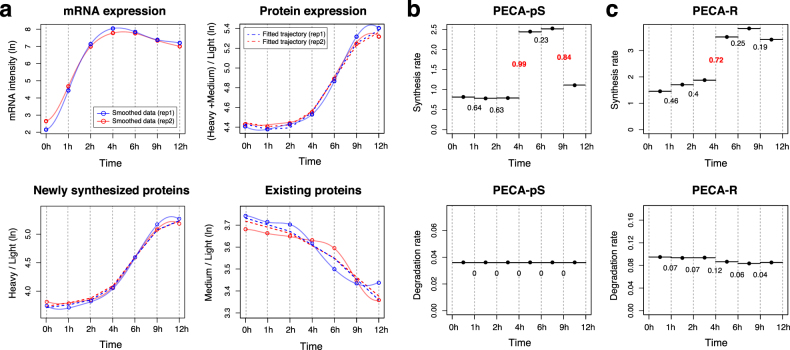
Fig. 4.
a Smoothed data (solid opaque lines) and consensus time course profile inferred by the fitted PECA models (dashed lines, fitted trajectory) for the heavy-labeled and medium-labeled channels for IFIT1 gene in the synthetic data derived from the LPS data set. b Synthesis rate and degradation rate profiles, inferred from H/L and M/L channels, respectively, with CPS scores from PECA-pS. c Synthesis and degradation rate profiles, simultaneously inferred from (H + M)/L with CPS scores from PECA-R

