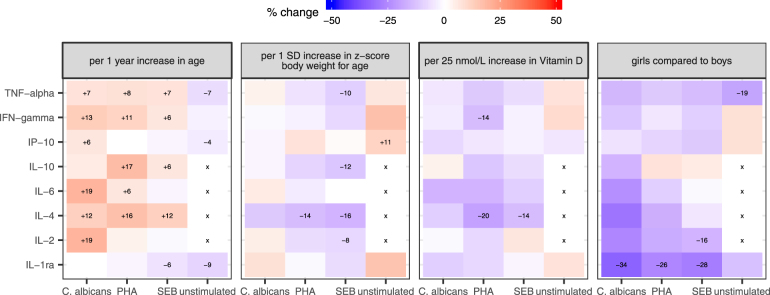
Figure 2.
Association of cytokine levels with age, body weight (z-score body weight for age), vitamin D concentrations and sex. The color indicates the general direction of association (red = increase, blue = decrease). The depicted numerical percentage (%) change per indicated unit was estimated from censored linear regression on log-transformed cytokine concentrations and is depicted for significant associations only (regression coefficient with a p-value < 0.05). X: no regression analysis performed since >50% of data below limit of quantification.

