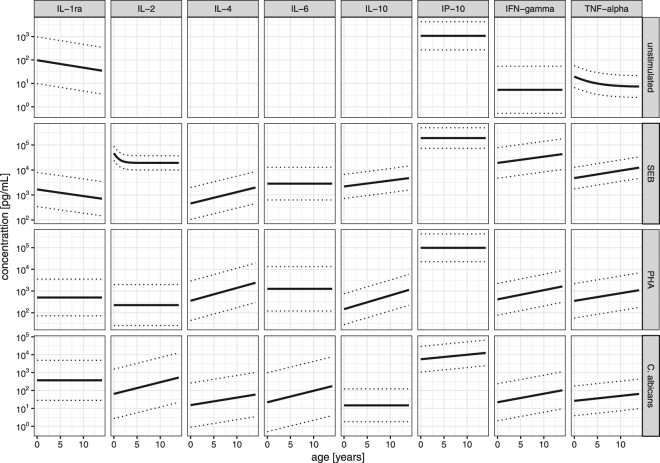
Figure 3.
Cytokine for age percentile; solid line represents the 50th and dotted lines the 5th and 95th percentile, respectively. Data are presented on a semi-logarithmic scale (log10-scale for cytokines, normal-scale for age). For cytokines 10−2 pg/mL equals a concentration of 0.01 pg/mL, 100 equals 1 pg/mL, 102 equals 100 pg/mL. Note that the depicted range of concentration differs between stimulants for better readability. For IL-2, IL-4, IL-6 and IL-10 percentiles for unstimulated samples were not quantifiable.

