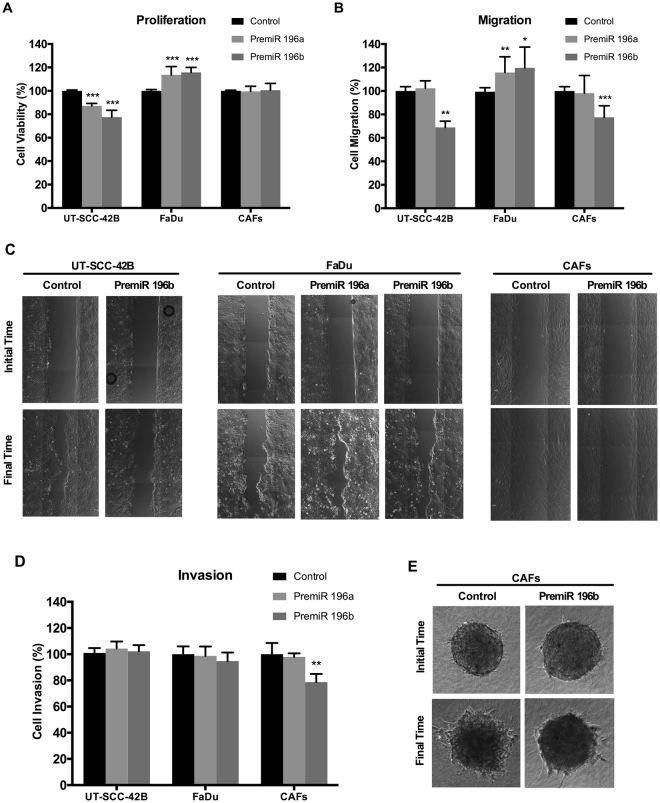
Figure 4.
Functional analysis of miR-196a and miR-196b in HNSCC-derived cell lines and CAFs. UT-SCC-42B, FaDu cells and CAFs were transfected with either premiR-196a, premiR-196b or non-targeting control, as indicated. (A) Cell proliferation was estimated by Tetrazolium-based MTS assay after 4 days. Data were normalized to the absorbance at day 0 and relative to control-transfected cells. (B) Bar chart showing the relative migration of UT-SCC-42B, FaDu or CAFs transfected with premiR-196a, premiR-196b or non-targeting control. (C) Representative images from the wound healing assays showing the initial scratch (t = 0) area and the residual area at each established final time (5, 15 or 20 h for UT-SCC-42B, FaDu or CAFs, respectively). (D) Bar chart showing the relative invasion of UT-SCC-42B, FaDu or CAFs transfected with premiR-196a, premiR-196b or non-targeting control. (E) Representative images from the 3D invasion assays of CAFs spheroids embedded into a collagen matrix. The invasive area was determined by calculating the difference between the final area (t = 20 h) and the initial area (t = 0) using Image J analysis program. All data were normalized to control-transfected cells and expressed as the mean ± SD of at least three independent experiments performed in quadruplicate. *p < 0.05, **p < 0.01 and ***p < 0.001 by Student t-test.

