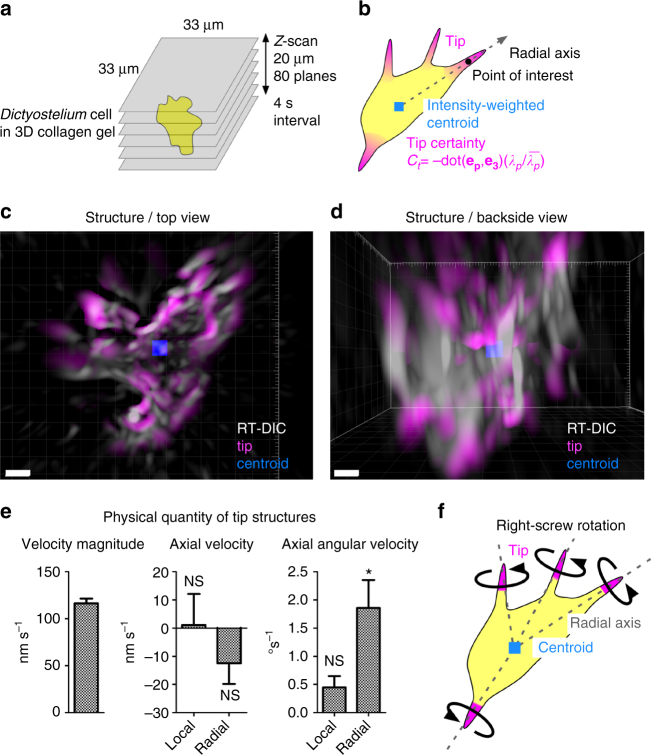
Fig. 7.
Whole-cell morphology and motility analyses of Dictyostelium. a Set-up for 3D time-lapse imaging. b Identification of tip structures from the tip certainty and calculation of tip motility along the radial axis from the intensity-weighted centroid. c, d Top c and backside d views of RT-DIC intensity (gray), intensity-weighted centroid (blue) and protrusions extracted by the tip certainty (magenta). Data from cell #1 c, d. e Summary of voxel-wise instantaneous tip motility. The values represent mean ± s.e.m. of the means for individual cells (n = 6). *P < 0.05, NS, P > 0.05. One sample t-test for the null hypothesis that the mean is equal to zero. f Right-screw rotation of tips about the radial axis revealed by the analysis. Scale bars, 5 μm

