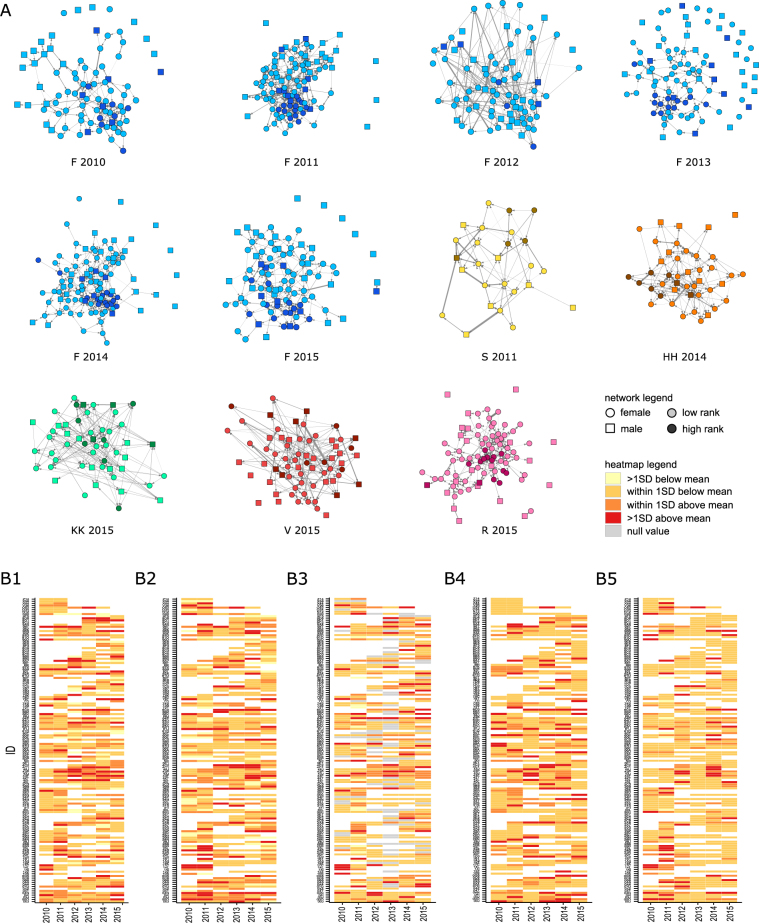
Figure 1.
(A) Grooming networks constructed using matrices of directional rates of grooming. Social group and year of observation are indicated under each network. Males are squares, females circles. High ranking animals are darker colours. (B) Heatmaps of network measures across years for individuals with >2 years of data: (B1) instrength, (B2) outstrength, (B3) clustering coefficient, (B4) betweenness, (B5) eigenvector centrality. Network measures range from low values (yellow) to high values (red) as shown in legend bars. Blank cells represent years with no data collected for an individual, grey cells in B3 represent animals with one or few social partners and thus null clustering coefficients.

