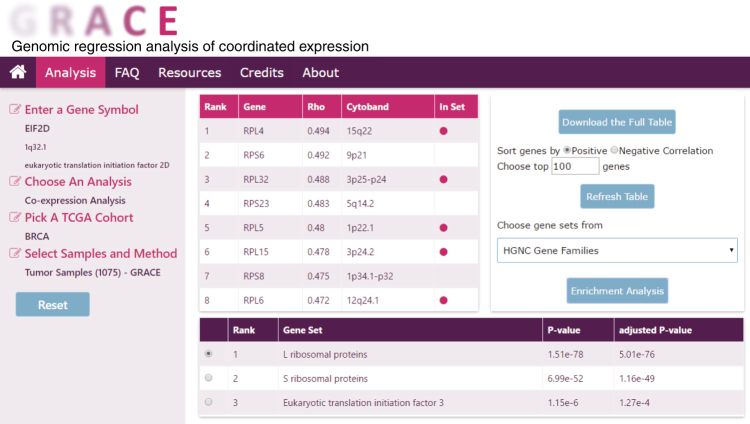
Fig. 5.
Co-expression analysis in web database GRACE. In the analysis page of the web database GRACE, upon entry of gene name, selection of “co-expression analysis” as the type of analysis and specification of cohort, sample types and method, a table of co-expressing genes will be generated. The result will include Spearman rank correlation coefficient and the chromosomal location for the co-expressing genes. Users may click the co-expressing gene names to be redirected to external websites for more information. Additional follow up analysis options are also provided. The user may download the full list of co-expressing genes, refresh the table with user specified sorting order and length of gene list, or run an enrichment analysis with a gene set library of their choice. In the resulting table of top enriched gene sets, the user may select from different gene sets and identify their members by the magenta dot in the “In Set” column of the co-expressing gene table

