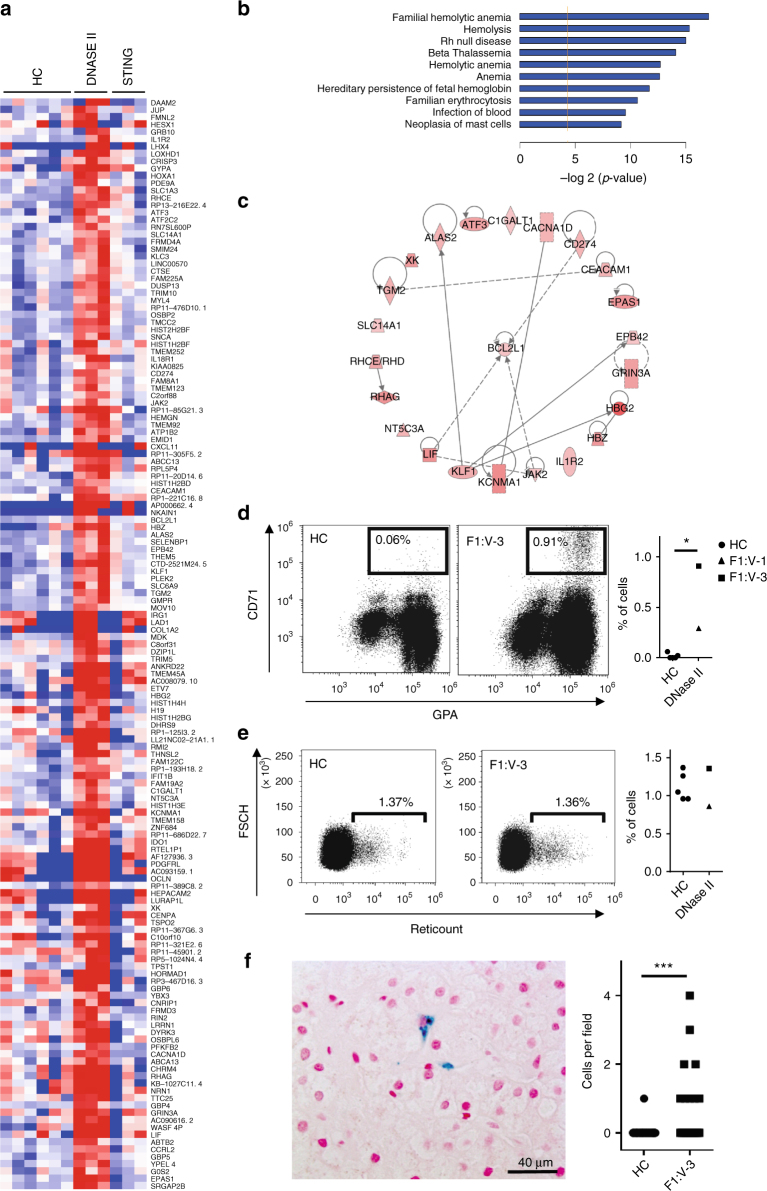
Fig. 6.
Effects of DNASE2 mutations on red blood cell homeostasis. Heat map of genes derived by statistical analysis of RNA-Seq data selected according to the following criteria: Control vs. DNase II fold change >2 or <−2 (Adj p < 0.05) and STING vs. Controls (Adj p > 0.05) and DNase II vs. STING; (Adj p < 0.05). b Histogram of the 10 hematological functions identified as the most significantly enriched by Ingenuity Pathway Analysis (IPA) of the genes derived in a. Genes included in these networks are annotated in c with known interactions symbolized by the dotted lines. d Representative dot plot of a CD71 GPA staining of blood from F1:V-3 vs. a healthy control (HC). Patients (n = 2) demonstrated an increased proportion of circulating CD71+, GPA+ erythroblasts compare to HC (n = 5). e Representative dot plot of a reticulocyte staining of blood from F1:V-3 vs. a healthy control. Reticulocyte percentage is comparable between patients (n = 2) and controls (n = 5). f Liver biopsy (x40) taken from F1:V-3 at age 8 years demonstrating increased numbers of enlarged Kupffer cells containing hemosiderin (identified by Perls’ stain). Quantification of the number of such cells per field in F1:V-3 (n = 20) compared to 2 age-matched non-inflammatory controls (HC) (n = 41) is given on the right (Mann–Whitney test, *p < 0.05; ***p < 0.001)

