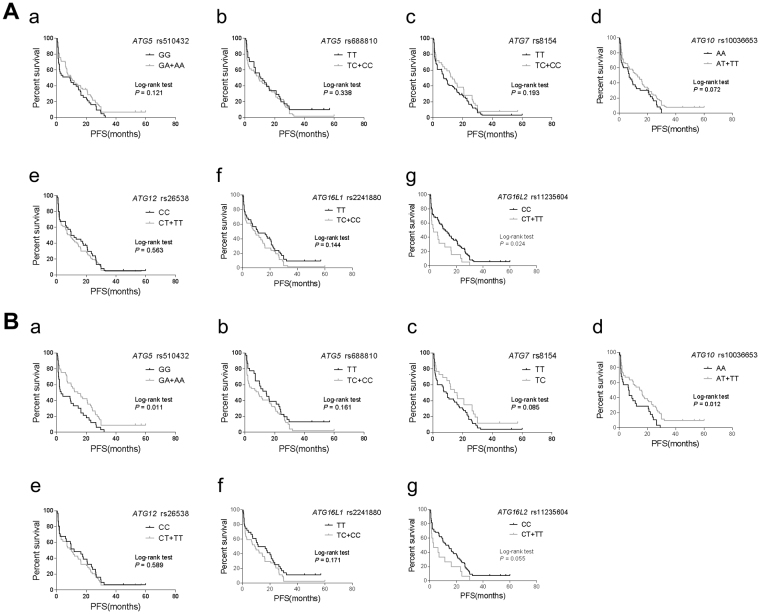
Figure 1.
Kaplan-Meier curves of PFS for advanced lung adenocarcinoma patients treated with gefitinib. (A) Kaplan-Meier curves of PFS for all NSCLC patients harboring ATG5 rs510432 (a), ATG5 rs6888810 (b), ATG7 rs8154 (c), ATG10 rs10036653 (d), ATG12 rs26538 (e), ATG16L1 rs2241880 (f) and ATG16L2 rs11235604 (g). (B) Kaplan-Meier curves of PFS for EGFR mutant NSCLC patients harboring ATG5 rs510432 (a), ATG5 rs6888810 (b), ATG7 rs8154 (c), ATG10 rs10036653 (d), ATG12 rs26538 (e), ATG16L1 rs2241880 (f) and ATG16L2 rs11235604 (g). Long-rank analysis was performed, and P values less than 0.05 were considered significant.

