Fig. 1.
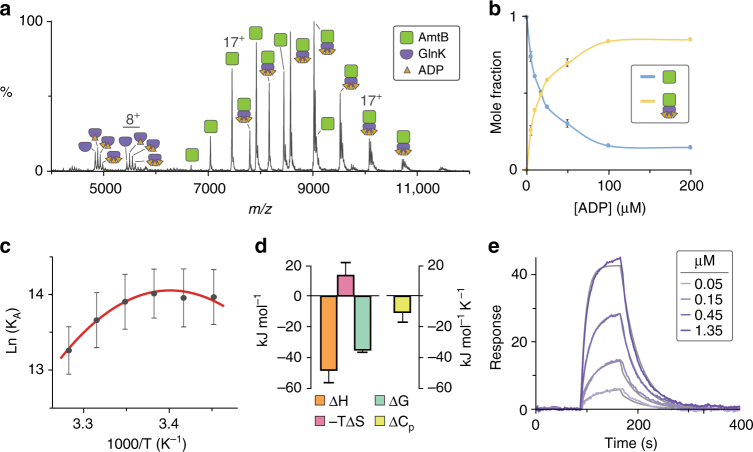
Biophysical characterization of the AmtB–GlnK complex by native MS and surface plasmon resonance. a Native mass spectrum of AmtB–GlnK at 2 μM in the presence of 50 µM ADP. b The effect of ADP concentration on GlnK association with AmtB determined by native MS. Plot of the mole fraction of AmtB and AmtB–GlnK as a function of total ADP concentration. Reported are the average and s.e.m. from repeated measurements (n = 2). c van’t Hoff plot for AmtB–GlnK binding in buffer containing 50 µM ADP (gray dots) as determined by native mass spectrometry and resulting fit (R 2 = 0.98) of the nonlinear “van’t” Hoff equation (red line). Reported are the average and s.e.m. from repeated measurements (n = 4). d Thermodynamic signature of AmtB–GlnK binding derived from native MS in the absence of lipid at 298 K. Reported are the average and s.e.m. from repeated measurements (n = 4). The change in free energy (ΔG) was calculated directly from repeated measurements of K D,AG at 298 K, and entropy (ΔS) was back calculated using both ΔH and ΔG (Supplementary Table 1). e Representative sensorgrams of AmtB injected at different concentrations over a sensor surface immobilized with GlnK at 298 K (purple lines) and resulting fit of a Langmuir 1:1 binding model (gray lines). Reported are the average and s.e.m. from repeated measurements (n = 4)

