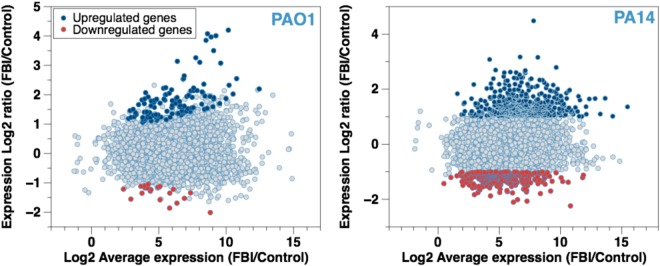
Figure 4.
MA (Mean-Average) Plot For Gene Expression Under FBI Conditions. Log2-fold of the change in expression vs. the Log2 average expression for each gene expressed by (a) PAO1 and (b) PA14 cells after confinement at a hexadecane-water interface for 1 h is presented. The total number of total mRNA expressed by the cells is plotted as a function of expression ratio. The blue and the red dots represent genes with significant changes in expression, by at least 2-fold with a false discovery rate (FDR) < 0.01.

