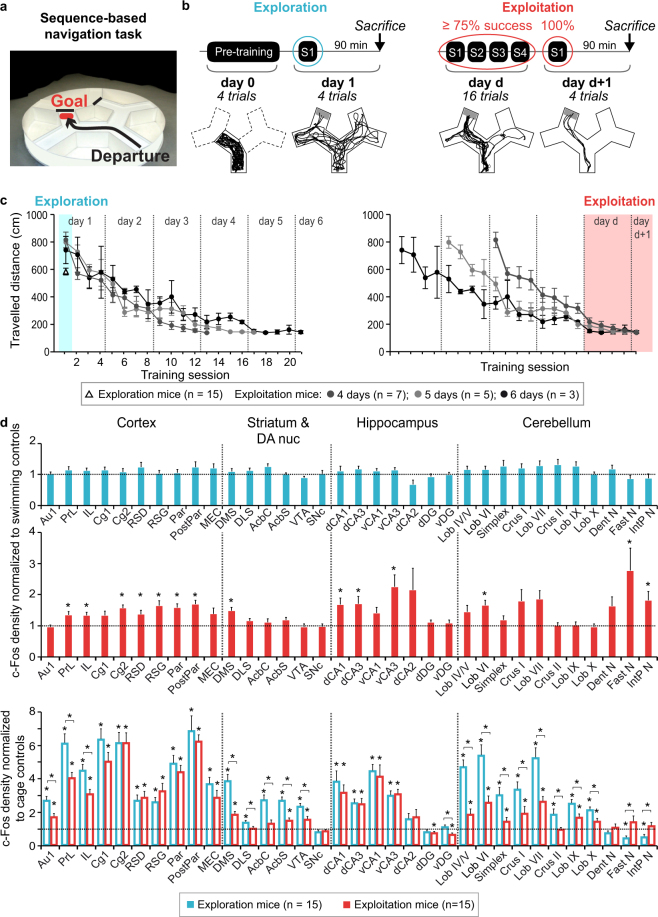
Figure 1.
Behaviour and activation patterns across exploration and exploitation of sequence-based memory. (a) Mice learned a two-turn path in the sequence-based navigation task. (b) Left panel: Exploration mice did a pre-training session and the following day one training session during which they discovered the task. Below are shown the four trajectories of one exploration mouse for pre-training and session 1. Right panel: exploitation mice did 4 daily sessions until performing over 75% successful trials in one training day and 100% successful trials in one session the following day. Below are shown an exploitation mouse’s trajectories (13/16 correct trials, 4/4 correct trials the following day). (c) Exploration (Δ; left) and exploitation mice (●) travelled distance per session, aligned to the first session (left) or to the respective exploitation mice’s last session (right). Exploitation mice reached the exploitation criterion within 4, 5 or 6 training days and had comparable performances on their respective last two training days (right panel) (p > 0.2 for Kruskal-Wallis comparisons). Data represents mean ± s.e.m. (d) Top and middle: c-Fos positive cell densities for exploration and exploitation mice normalized to their respective swimming controls. Bottom: To compare c-Fos positive cell densities for exploration and exploitation mice, they are normalized to cage controls. Swimming and cage controls averages are indicated by the dotted horizontal lines. Exploration mice did not show any difference with their swimming controls, yet most structures had increased c-Fos positive cell densities compared to cage control mice. Exploitation mice showed increased activity in several areas, mostly cortical and hippocampal. The deep cerebellar fastigial and interpositus nuclei had a unique pattern of decreased activity in exploration mice compared to cage controls and increased c-Fos positive cell density in exploitation mice. *indicate significant differences (q < 0.05, FDR corrected, Mann Whitney comparisons). Data represents mean ± s.e.m. Abbreviations: cortex: primary auditory (Au1), prelimbic (PrL), infralimbic (IL), cingulate 1 and 2 (Cg1, Cg2), dysgranular and granular retrosplenial (RSD, RSG), parietal and posterior parietal (Par, PostPar), medial entorhinal (MEC); striatum and dopaminergic nuclei (DA nuc): dorsomedial striatum (DMS), dorsolateral striatum (DLS), nucleus accumbens core (AcbC) and shell (AcbS), ventral tegmental area (VTA), substantia nigra pars compacta (SNc); hippocampus: dorsal CA1 (dCA1), dorsal CA3 (dCA3), ventral CA1 (vCA1), ventral CA3 (vCA3), dorsal CA2 (dCA2), dorsal and ventral dentate gyrus (dDG, vDG); cerebellum: lobules IV/V (Lob IV/V), VI (Lob VI), VII (Lob VII), IX (Lob IX), X (Lob X), Simplex (Spx), dentate (Dent N), fastigial (Fast N) and interpositus nuclei (IntP N).

