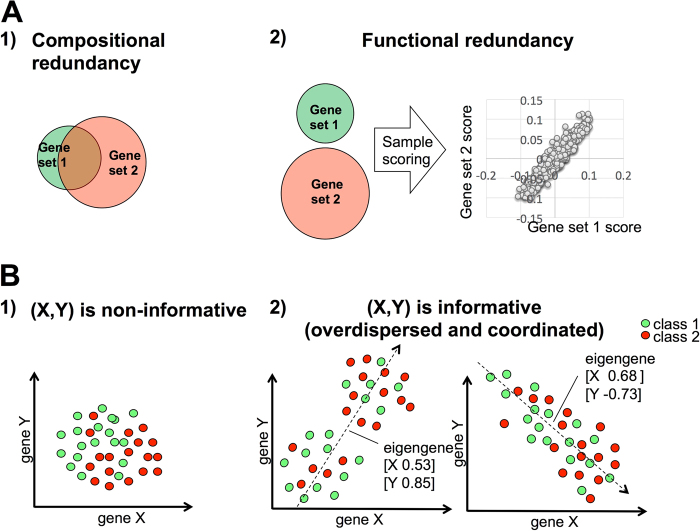
Fig. 1.
Schematic explanation of the basic notions used in this study. Panel a schematically summarizes the two possible forms of redundancy between two gene sets. (1) Compositional redundancy corresponds to gene set overlap. (2) Functional redundancy represents instead different transcriptional read-outs of the same biological process and it is possible even for the gene sets with no overlap. Measuring functional redundancy depends on the way a sample is scored based on the expression of its genes and the chosen corpus of data. Panel b explains the difference between non-informative (1) and informative (2) gene sets. A signature composed of two genes X and Y is here considered. The circles denote biological samples and the two colors correspond to two different labels: class 1 and class 2 (e.g., metastatic vs. primary tumors). Scatter plots are used to represent the expression values of gene X (x-axes) and gene Y (y-axes) in each sample. Three types of samples distributions are shown. In (1) (isotropic case), no naturally distinguished axis in the points' distribution, labeling of samples is needed to define their ranking. In (2) instead, it exists as a distinguishable axis in the data distribution that allows a robust ranking of the samples independently on their labeling. Both second and third scenario leads to overdispersion and coordination of the corresponding gene set and are selected in the analysis

