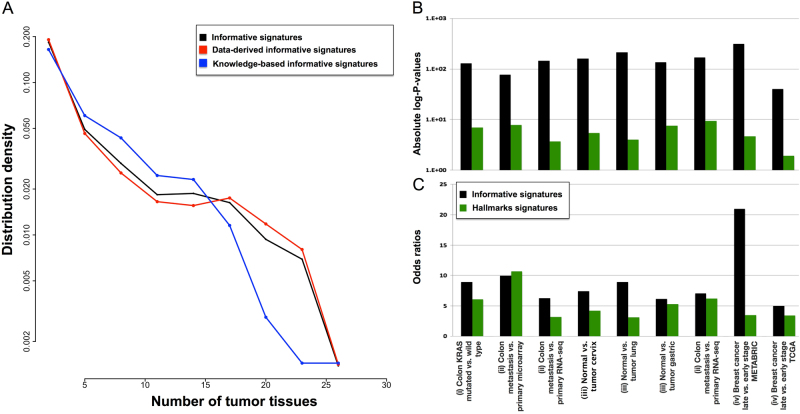
Fig. 2.
Properties of the informative signatures in different cancer types. In a, the distribution of the number of cancer types in which the informative signatures have ROMA L1 and L1/L2 p-values significant is reported (logarithmic scale). The behavior of all informative signatures, data-driven informative signatures, and knowledge-based informative signatures is represented in black, red, and blue, respectively. In b and c, the comparison between Informative (black) and Hallmarks (red) signatures is reported in all nine comparative tests cases. Enrichment of the corresponding subset (informative or Hallmarks) in the output of GSEA is evaluated in terms of Fisher absolute log-p-values and odds ratio, respectively

