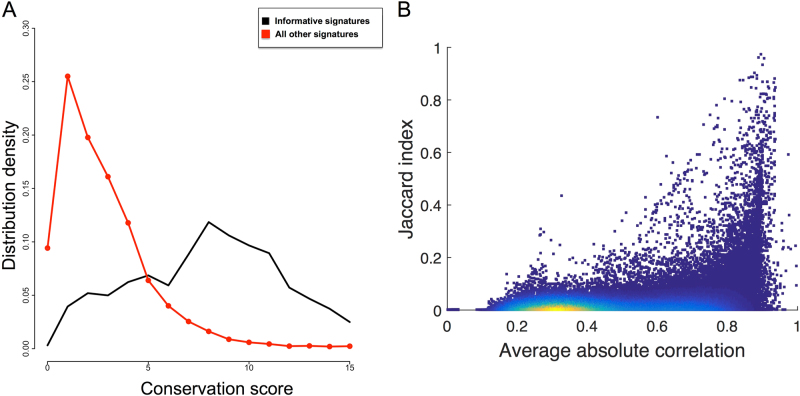
Fig. 3.
Pan-cancer correlations between the eigengenes of the informative signatures and the sample activity profiles. In a, the distribution of the conservation scores for the Informative (black) and the remaining signatures (red) is reported. In b, the dependence between informative gene sets overlap (Jaccard-index) and average correlation between the meta-samples defined by the informative gene sets is reported. Each point corresponds to an informative signature and their color is proportional to the point density: from red (high density) to blue (low density)

