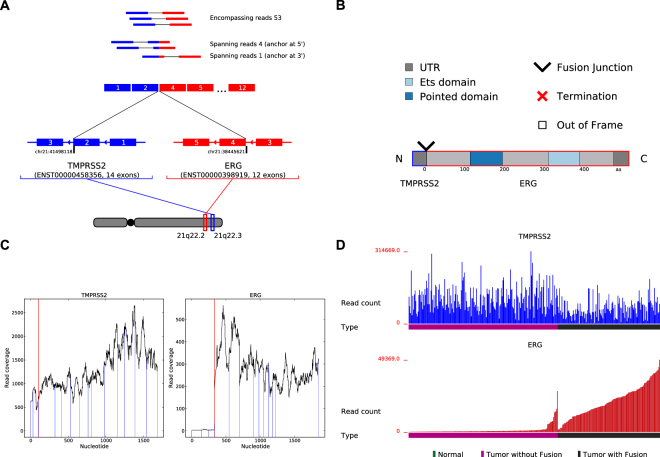
Figure 2.
INTEGRATE-Vis output illustrated using the TMPRSS2-ERG gene fusion in prostate cancer. INTEGRATE-Vis outputs four visualizations including: (A) gene fusion transcript isoforms, (B) the predicted protein structure of the gene fusion, (C) RNA-Seq read coverage across each gene fusion partner to reveal changes in exon expression (A red line is plotted at the fusion junctions at both gene partners. Exon boundaries are represented by blue lines. A marked expression change occurs between exons 3 and 4 of ERG.), and (D) expression of each gene fusion partner across the TCGA PRAD cohort. Blue is used to represent supporting reads, exons, transcript, and genomic locations for the 5′ gene partner (TMPRSS2), while red is for those of the 3′ gene partner (ERG).

