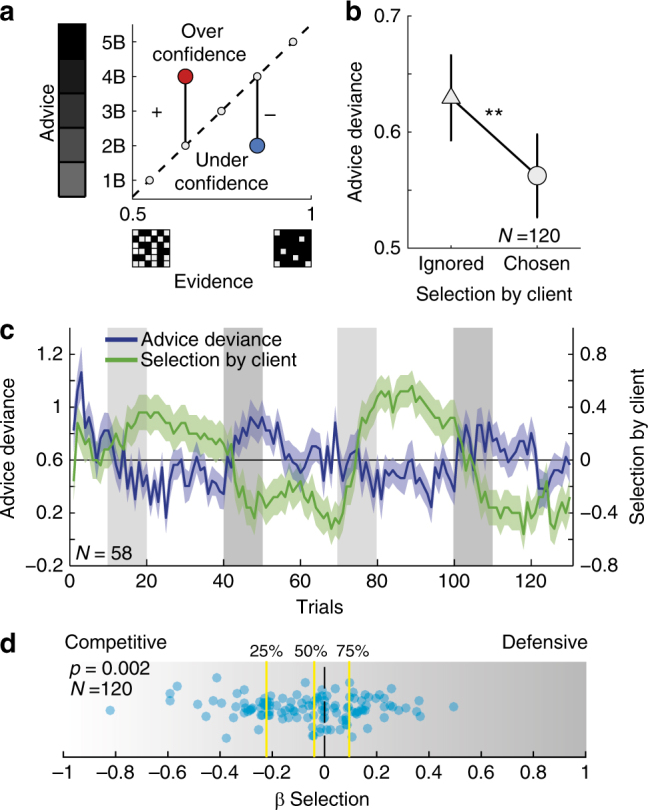
Fig. 2.

Selection by client effect on advice. a Deviance of advice from probabilistic evidence. Confidence is plotted against evidence grid, i.e., probability that coin is in the black urn. The dashed line represents zero-deviance policy in which confidence matches the ratio of black to white squares in the evidence grid. Overconfident advice (red circle) would lie above the dashed line and was defined as positive deviance; conversely, underconfident advice (blue circle) corresponded to negative deviance. b Averaged advice deviance under high vs. low selection (paired t-test, t(119) = 3.10, P = 0.002). c The dynamic interplay of selection and advice deviance in the online experiment. Blue line = trial-by-trial average advice deviance. Green line = average selection. Light green and blue = SEM. Light and dark grey blocks mark periods of low evidence reliability for the rival and for the participant, respectively (see Fig. S1). d Our best-fitting model contained a parameter governing how selection by client affect advice deviance, ‘β-Selection’. Positive values of β-Selection are associated with the defensive strategy, i.e., increased advice deviance when being selected. Negative values are associated with the competitive strategy, i.e., decreased advice deviance when being chosen by the client. Despite high level of individual differences, this parameter was significantly lower than 0 across participants (Mean ± SEM = −0.08 ± 0.02, t(119) = 3.12, P < 0.002), in line with our previous analyses
