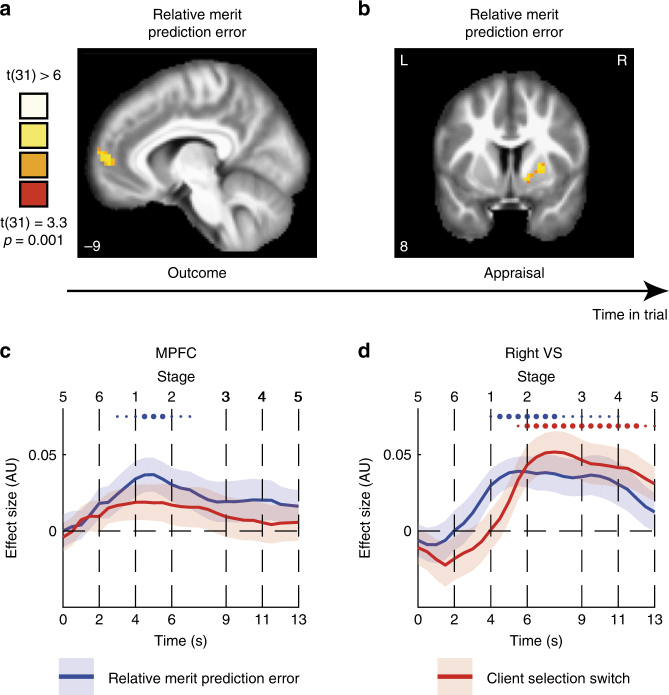
Fig. 5.
Encoding of relative merit prediction errors. During the outcome stage, a whole brain analysis showed that activity in mPFC was positively modulated by the trial-by-trial relative merit prediction error, i.e. the differences between prognostic value comparison and previous reltive merit (Fig. 2d, eq. (1)) (P < 0.001, FWE cluster size-corrected P < 0.05, see Figure S7 for uncorrected map). b During the Appraisal stage, activity in the VS followed the relative merit prediction error (P < 0.001, FWE cluster size-corrected P < 0.05, see Figure S8 for uncorrected map). c Time course of the effects of relative merit prediction error (blue) and client selection switches (red) from the mPFC (MNI coordinates [x,y,z]: [−9,56,5]). Time courses are presented across all stages of a trial, from the showdown stage (5) of a preceding trial to the showdown stage (5) of the current trial. Thick lines indicate mean effect size, the shaddows indicate the SEM, small dots indicate P < 0.05 in these time points, and big dots indicate P < 0.005. These time courses demonstrate the temporal order of coding of relative merit and selection by client in VS. Thick lines: mean effect size. Shadows: SEM. d Time courses sampled from the right VS (coordinates: [18,8,−10], defined by Neurosynth), demonstrating the temporal order of coding of relative merit PE and client selection switch

