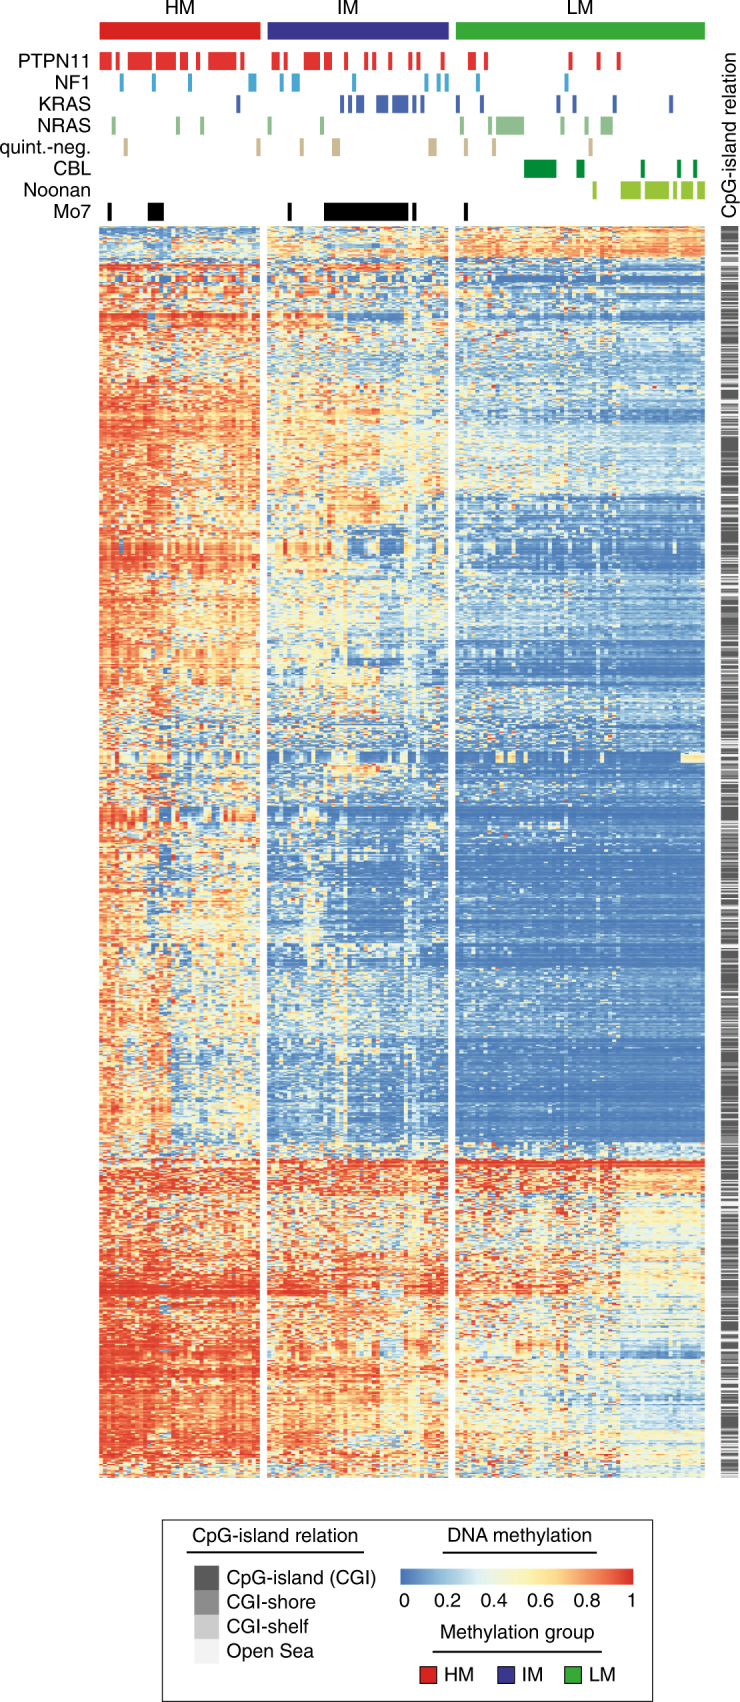
Fig. 2.

JMML-specific aberrant methylation patterns characterize three distinct JMML subgroups. Heatmap displaying beta values for the 1,000 most variable jmmlDMPs (rows) across all samples from the validation cohort (n = 147). Samples (columns) are ordered according to the consensus clustering results (Supplementary Fig. 2a). Clustering was performed using Manhattan distance and Ward’s linkage. Clinical annotation for “genotype” (somatic mutations in PTPN11, KRAS, and NRAS, germline or somatic CBL mutations; clinical and/or molecular diagnosis of neurofibromatosis: NF1; quintuple-negative: quint.-neg.; Noonan: clinical and/or molecular diagnosis of Noonan syndrome) and karyotype is depicted on top of the heatmap. Relative DNA methylation levels are shown from light blue (0) to red (1), and localization of jmmlDMPs relative to CpG-islands is depicted on the right in gray scale
