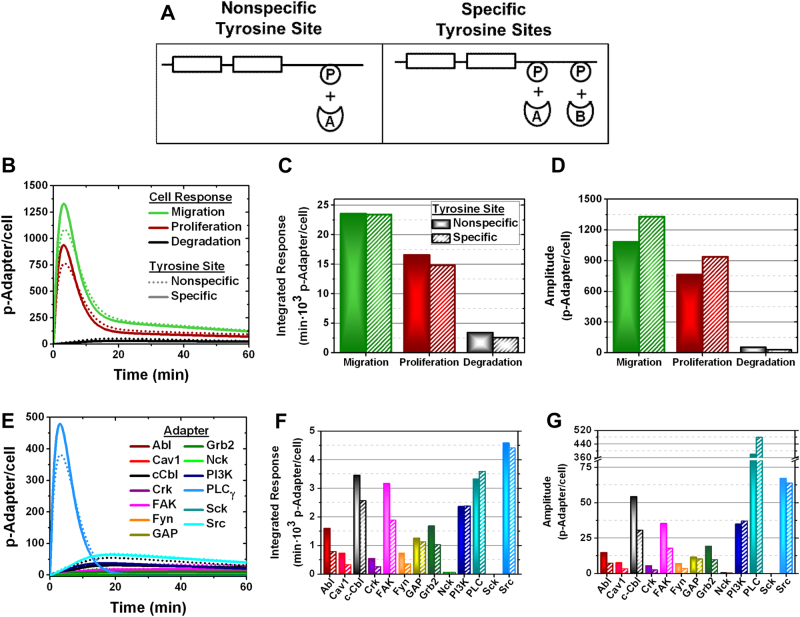
Fig. 2.
The VEGFR1 structure preferentially activates PLCγ and PI3K. a Schematics for the VEGFR–adapter interaction models: (left) adapters bind a single nonspecific VEGFR tyrosine site vs. (right) adapters binding specific VEGFR tyrosine sites. Here adapters are shown in a generalized form, labeled A and B, P represents a phosphorylated receptor Tyr site, and the plus symbol indicates an adapter binding the phosphorylated receptor Tyr site. VEGFR-induced cell responses were modeled by calibrating adapter phosphorylation to each specific cell response, described in the Supplementary Information. HUVEC signaling stemming from VEGFR1 specifically was quantified to determine b VEGFR1-induced cell response dynamics, c the integrated cell responses (area under the cell response–time curve), and d cell response phosphorylation amplitudes. Likewise, e VEGFR1-mediated adapter phosphorylation dynamics in HUVECs are analyzed to quantify f integrated adapter responses (area under the adapter phosphorylation–time curve) and g adapter phosphorylation amplitudes

