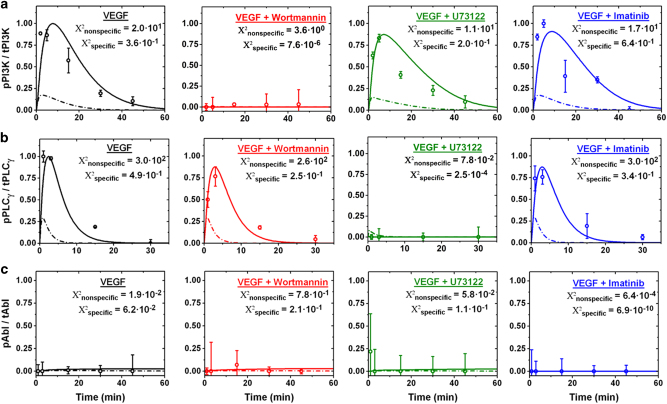
Fig. 4.
VEGFR1 phosphorylates PI3K and PLCγ with model predicted dynamics. a PI3K, b PLCγ, and c Abl phosphorylation in RAWs were quantified with ELISAs at multiple time points given treatment with VEGF-A164 (50 ng/mL), 100 nM Wortmannin (PI3K inhibitor), 10 µM U73122 (PLCγ inhibitor), and 6 µM Imatinib Mesylate (Abl inhibitor). Data are represented as the mean phosphorylated over mean total protein (p/t) ratio ± standard error of the mean (SEM) for each treatment type and treatment time; here SEM is the sum of the phosphorylated and total protein SEMs. The p/t ratio given inhibitor treatment specific to the protein of interest was subtracted as background for each treatment time. Predicted adapter phosphorylation with modeling a single nonspecific (dashed line) vs. physiologically specific (solid line) VEGFR tyrosine sites are shown compared to experimental data (open circles). Model predictions include adapter phosphorylation contributions from both VEGFR1 and VEGFR2 for validation purposes. Goodness of fit is tested by the Χ2 goodness-of-fit test28

