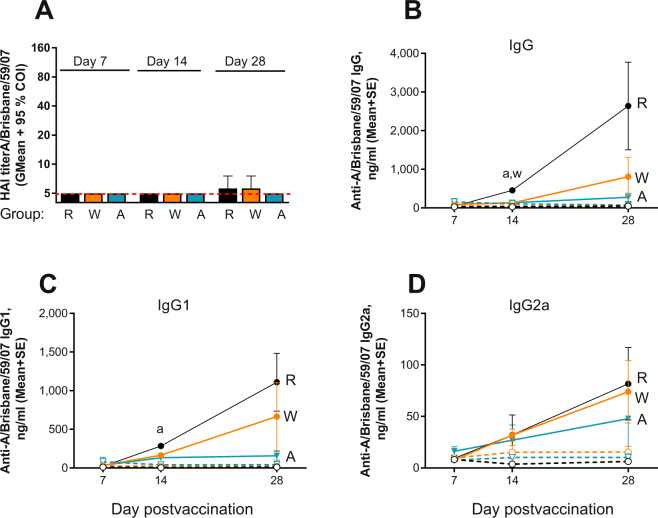
Figure 3.
Effect of AT on the antibody response to vaccination in systemically immunized groups. Groups: R - RD (n = 6, black symbols), W - WD (n = 6, orange symbols), A - AT (n = 5, blue symbols): (A) HAI titers measured at days 7, 14 and 28 post immunization. Samples below limit of detection including all naïve samples (n = 4 in RD, n = 6 in WD, n = 5 in AD) were assigned a titer of 5 (red broken line) for calculations. Data are presented as geometric means with 95% confidence intervals. (B–D) Total vaccine-specific IgG, IgG1, and IgG2a, respectively. Filled and open circles connected with solid or broken lines represent immunized and naïve groups, respectively. Data are presented as means with SE where “a” and “w” denote statistically significant differences between the RD group and AT or WD groups, respectively: p = 0004 and 0.001 for “a” and “w”, respectively, at d 14 on panel B; p = 0.016 and 0.049 for “a” at day 14 and 28, respectively on panel C. Detailed antibody responses of individual mice are shown in Supplemental Fig. 5.

