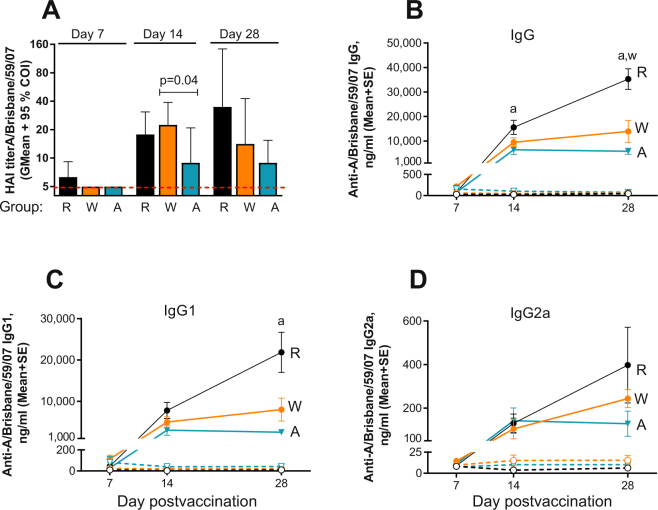
Figure 4.
Effect of AT on the antibody response to vaccination in MNP groups. (A) HAI presented as described in Fig. 3. Groups: R - RD (n = 6, black symbols), W - WD (n = 6, orange symbols), A - AT (n = 6, blue symbols). (B–D) Total vaccine-specific IgG, IgG1, and IgG2a, respectively. Filled and open circles connected with solid or broken lines represent immunized and naïve groups, respectively. “a” and “w” represent differences described in the legend for Fig. 3: p = 0.026 for “a” at day 14, p < 0.001 and p = 0.006 for “a” and “w” respectively at 28 on the panel B; p = 0.0026 for “a” on panel C. Detailed antibody responses of individual mice are shown in Supplemental Fig. 6.

