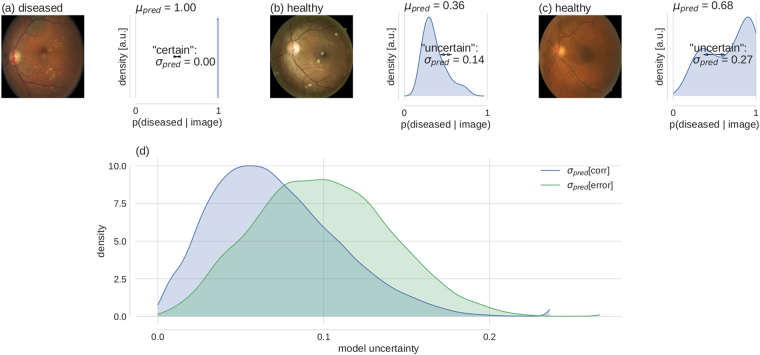
Figure 1.
Bayesian model uncertainty for diabetic retinopathy detection. (a–c) left: Exemplary fundus images with human label assignments in the titles. (a–c) right: Corresponding approximate predictive posteriors (Eq. 6) over the softmax output values p(diseased | image) (Eq. 1). Predictions are based on μ pred (Eq. 7) and uncertainty is quantified by σ pred (Eq. 8). Examples are ordered by increasing uncertainty from left to right. (d) Distribution of uncertainty values for all Kaggle DR test images, grouped by correct and erroneous predictions. Label assignment for “diseased” was based on thresholding μ pred at 0.5. Given a prediction is incorrect, there is a strong likelihood that the prediction uncertainty is also high.

