Figure 4.
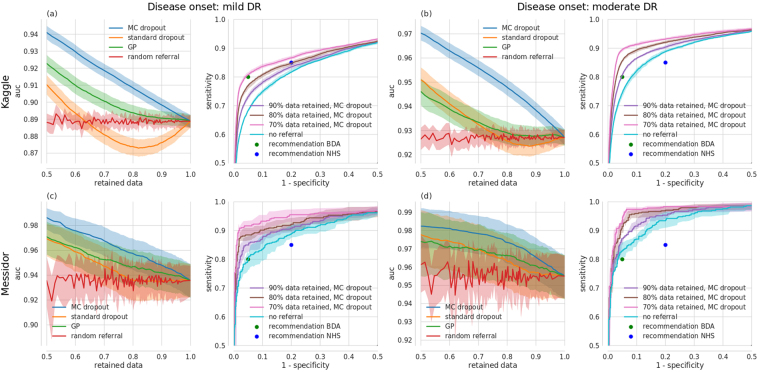
Improvement in receiver-operating-characteristics via uncertainty-informed decision referral for different networks/tasks (left vs. right double column), datasets (1st vs. 2nd row) and methods (1st and 3rd single column). (a), left) ROC AUC over the fraction of retained data under uncertainty informed (MC dropout: blue, Gaussian process: green, standard dropout: orange) and random (red) decision referral for a Bayesian CNN, trained for disease onset 1 and tested on Kaggle DR. (a, right) Exemplary ROC curves under decision referral using the best method from (a, left), that is MC dropout. ROC curves improve when increasing the number of referred samples (90/80/70% retained data: purple/brown/pink curves respectively) as compared to no referral (turquoise). Panels (b)–(d) have the same layout. National UK standards for the detection of sight-threatening diabetic retinopathy (in73 defined as moderate DR) from the BDA (80%/95% sensitivity/specificity, green dot) and the NHS (85%/80% sensitivity/specificity, blue dot) are given in all subpanels with ROC curves. (b) same as (a), but for disease onset 2. (c) Same network/task as in (a), but tested on Messidor. (d) Same network/task as in (b), but tested on Messidor.

