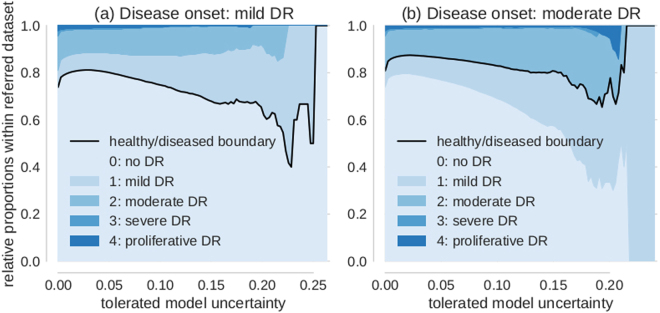
Figure 6.
Proportion of disease levels in referred datasets. The value on the x-axis indicates the uncertainty of a sample to be tolerated for automatic diagnosis. All samples in the referral dataset have thus uncertainties of at least the value on the x-axis. The relative proportion of disease levels for tolerated uncertainty = 0 corresponds to the prior. (a) Disease onset level is mild DR (1). Disease levels 0 and 1 neighbour the healthy/diseased boundary (black) and dominate the referral dataset for high but not intermediate uncertainty. (b) Disease onset level is moderate DR (2). In analogy to (a), disease levels 1 and 2 neighbour the healthy/diseased boundary (black) and dominate the decision referral populations with high in contrast to intermediate uncertainties.

