
Figure 1.
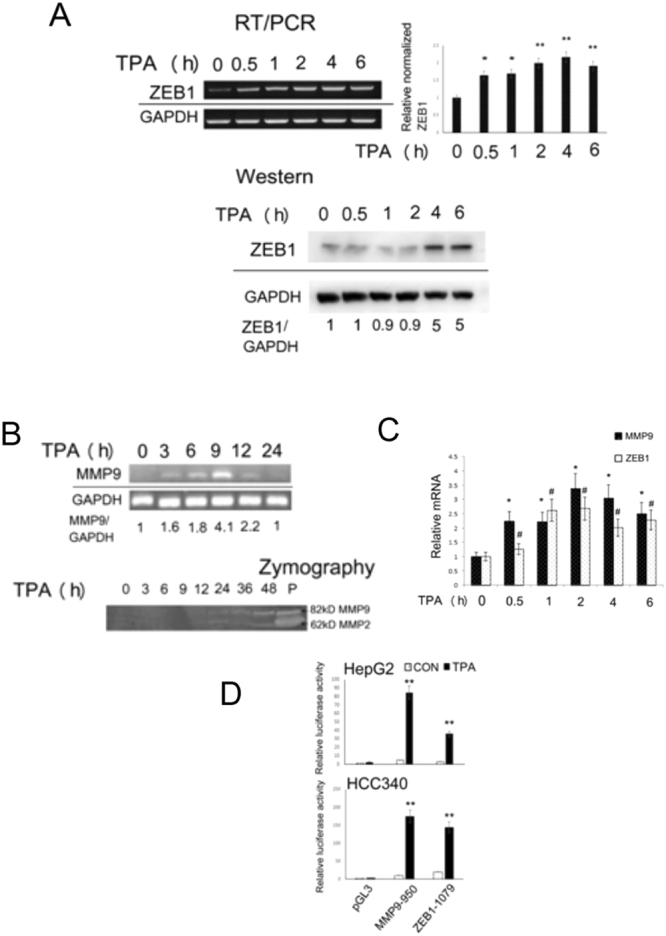
TPA induced gene expression of MMP9 and ZEB1. HepG2 cells (A,B,C and D upper panel) and HCC340 (D lower panel) were treated with 50 nM TPA for indicated times (A,B,C) or 12 h (D). RT-PCR of ZEB1 (A, upper panel) and MMP9 (B, upper panel), quantitative RT-PCR of ZEB1and MMP9 (C), Western blot of ZEB1 (A, lower panel) and dual luciferase promoter assay of MMP9-950 and ZEB1-1079 (containing full length promoters of MMP9 and ZEB1) (D), were performed. In the upper panel of (A), relative ZEB1 cDNA (normalized with GAPDH) was quantitated, taking the data of time zero as 1.0. (**,*) represent the statistical significant difference (p < 0.005, p < 0.05, N = 3) of ZEB1 cDNA between the indicated samples and the time zero group. In lower panel of (A) and upper panel of (B), the numbers below the figure are the relative ZEB1 protein and MMP9 cDNA (normalized with GAPDH), respectively, taken the data of time zero as 1.0. The data are average of three reproducible experiments with coefficient of variation (C.V) of 8.0%. Lower panel of B demonstrated the Zymography of active MMP9 (82kD) and MMP2 (62kD) secreted into the conditioned mediums of TPA-treated HepG2 collected at the time indicated. The molecular weights of MMP9 and MMP2 are verified by respective MMP standards denoted as “P” in the most right lane. The figure is representative of two reproducible experiments. In (C), relative mRNA was calculated in the quantitative real time RT-PCR analysis, taking the data of time zero as 1.0. (*) and (#) represent the statistically significant difference (p < 0. 05, N = 3) of relative mRNA of MMP9 and ZEB1 between each of the TPA-treated samples and time zero group. In (D), the relative activity of each promoter was quantitated, taking the data of pGL3 as 1.0. (**) represent the statistical significant difference (p < 0.005, N = 4) of relative promoter activity between each of the TPA-treated samples and untreated group.