
Figure 2.
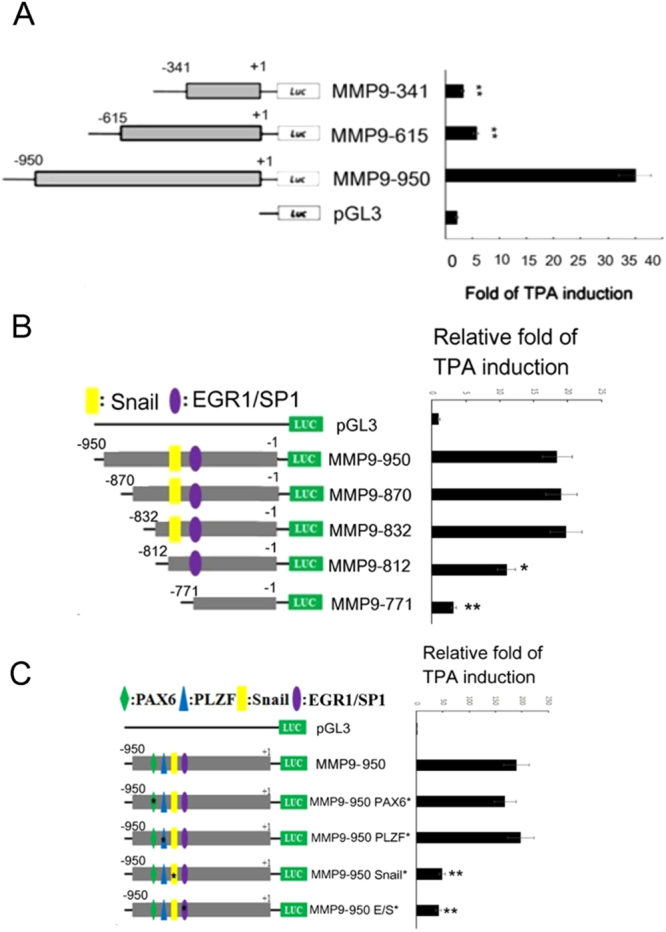
Deletion mapping and mutagenesis analysis for TPA-responsive element in MMP9 promoter. HepG2 cells were transfected with pGL3 vector, the indicated MMP9 promoter plasmids including full length promoter (MMP9-950) (A,B,C), various 5′ deleted promoters (A,B), or mutant promoters with alteration on the putative binding region of indicated transcriptional factors (C) for 24 h. Subsequently, the cells were untreated or treated with 50 nM TPA for 12 h and then dual luciferase assay were performed. The relative fold of TPA induction for each promoter were quantitated as the activity of TPA treated vs untreated (demonstrated on the right panel), taking the data of pGL3 as 1.0. (**,*) represent the statistically significant difference (p < 0.005, p < 0.05, respectively, N = 4) of relative TPA-induced promoter activity between each of the indicated samples and the full length promoter (MMP9-950) group.