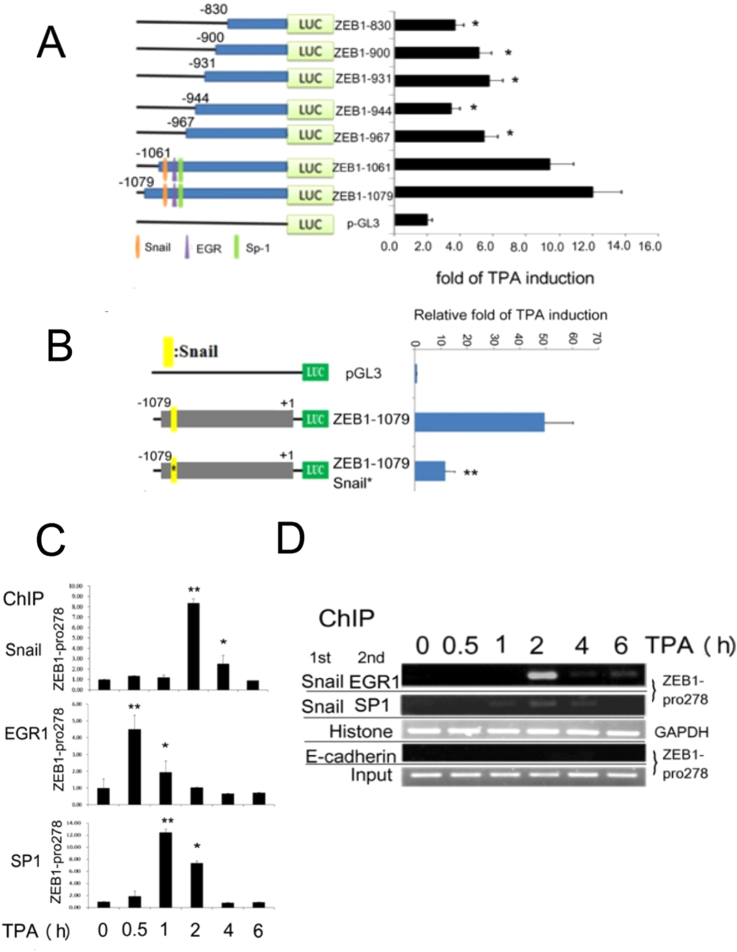
Figure 5.
Identification of TPA-responsive region on ZEB1 promoter and TPA induced binding of Snail, EGR and SP1 to specific region of ZEB1 promoter. (A) and (B). HepG2 cells were transfected with pGL3 vector, the indicated promoter plasmids with full length promoter (ZEB1–1079), various 5′deleted promoters (A) or ZEB1-1079 Snail * with alteration on the proposed Snail binding motif (B) for 24 h. Subsequently, the cells were untreated or treated with 50 nM TPA for 12 h and then dual luciferase assay were performed. The relative TPA-induced promoter activities for each promoter plasmid were quantitated as the activity of TPA-treated vs. untreated, taking the data of pGL3 as 1.0 (demonstrated on right panel). (*) represent the statistical significant differences (p < 0.05, N = 3) of relative TPA-induced promoter activity between the indicated samples and the ZEB1-1079 vector group. (C) HepG2 cells were treated with 50 nM TPA for the indicated times. ChIP assay for Snail, EGR1 and SP1 binding on ZEB1 promoter region of covering 278 bp within TPA responsive element (ZEB1-pro278) (Fig. S2B). Quantitative PCR were performed for estimating the binding of indicated transcriptional factor on ZEB1-pro278 normalized with the binding of histone3 on GAPDH promoter. Relative binding of each transcriptional factor on ZEB1-pro278 were calculated, taking the data of time zero as 1.0. (D) HepG2 cells were treated 50 nM TPA for indicated times. Double ChIP of 1st Snail ChIP followed by 2nd SP-1ChIP or 2nd EGR ChIP was performed. ChIPs of histone binding on GAPDH promoter and E-cadherin on MMP9 promoter are used for positive and negative control, respectively. The figure is representative of two reproducible experiments. The lines between the images in (D) are included for dividing gels of different ChIP assays of indicated molecules.

