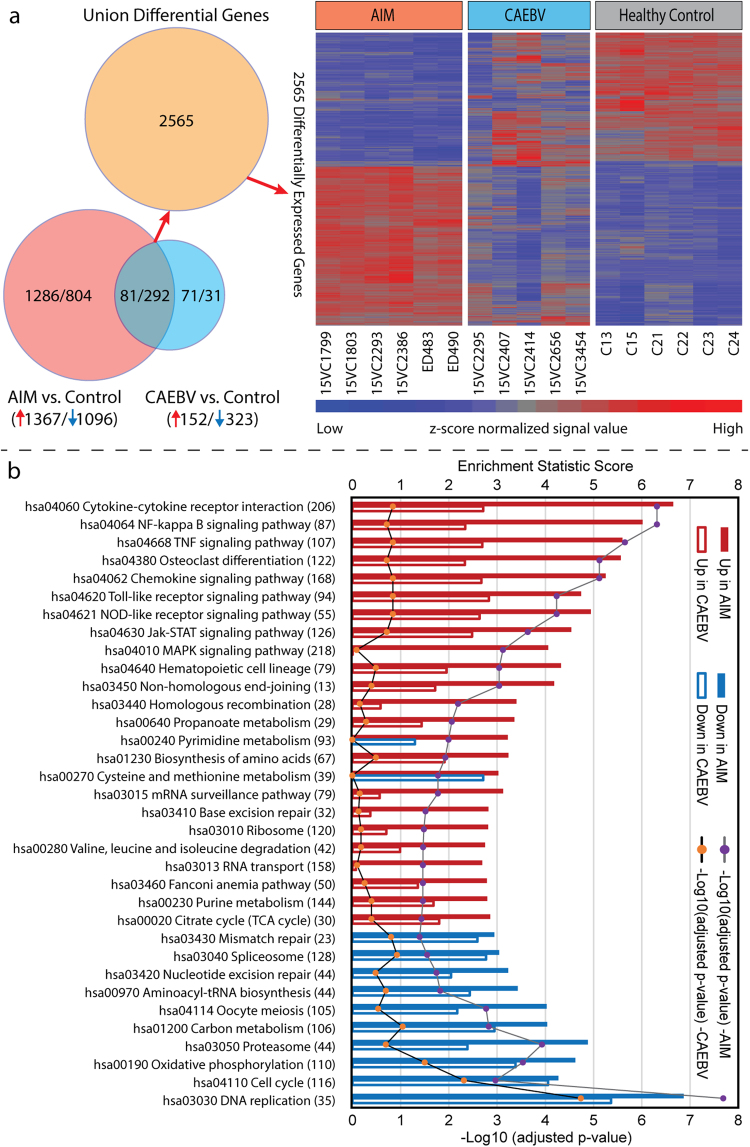
Figure 1.
Overview of the whole transcriptome regulation in our primary cohort. (a) Differentially expressed union 2565 genes’ profiles for 6 acute infectious mononucleosis (AIM), 5 chronic active EBV infection (CAEBV) and 6 healthy control subjects. The Venn diagram depicts how many genes were differentially expressed in each comparison and how many genes overlapped between comparisons. Intensity values were normalized by quantile across samples and by z-score across genes. In the heatmap, each row represents a gene and each column represents a sample, with the 17 samples labeled at the bottom. (b) Significantly enriched KEGG pathways. Each pathway is labeled by KEGG pathway ID and name. The number of genes in a pathway is given in parenthesis. Solid bars are for AIM, and open bars are for CAEBV. Up-regulation is marked with red and down with blue. The p-value reflects the level of confidence for enrichment significance; and the enrichment score is an equivalent to the t value in a Student t-test and can be a gauge for the degree of pathway dysregulation.

