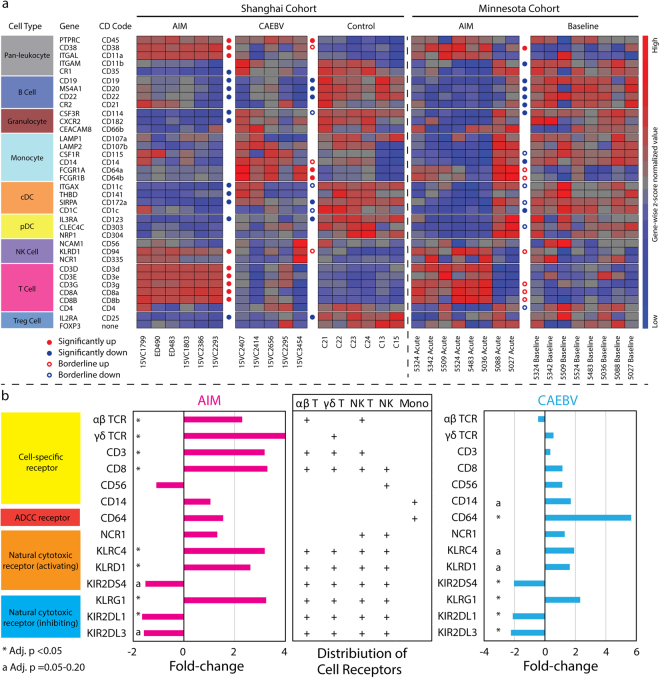
Figure 3.
Expression patterns of immune cell markers and cytotoxicity cell receptors. (a) The expression of the 36 major immune cell markers was profiled with transcriptome data from our primary cohort (Shanghai) and the Minnesota cohort. “Significantly up or down” signifies that fold-change and adjusted p-value for the gene met the interpretation cutoffs set in the Method section, i.e. absolute fold-change >= 1.5 & adjusted p < 0.05. “Borderline up or down” indicates that these genes met the fold-change cutoff but the adjusted p-values for these genes were in the range of 0.05 to 0.20. Sample IDs are labelled at the bottom of heat maps. cDC: conventional myeloid dendritic cell, pDC: plasmacytoid dendritic cell, and Treg: T regulatory cell. (b) The expression regulation of major cytotoxicity cell receptors was analyzed with transcriptome data from our primary cohort. Mean fold-change and adjusted p values were used in the bar chart for TCRs, CD3, CD8, and CD64 expression. ADCC: antibody-dependent cell-mediated cytotoxicity.

