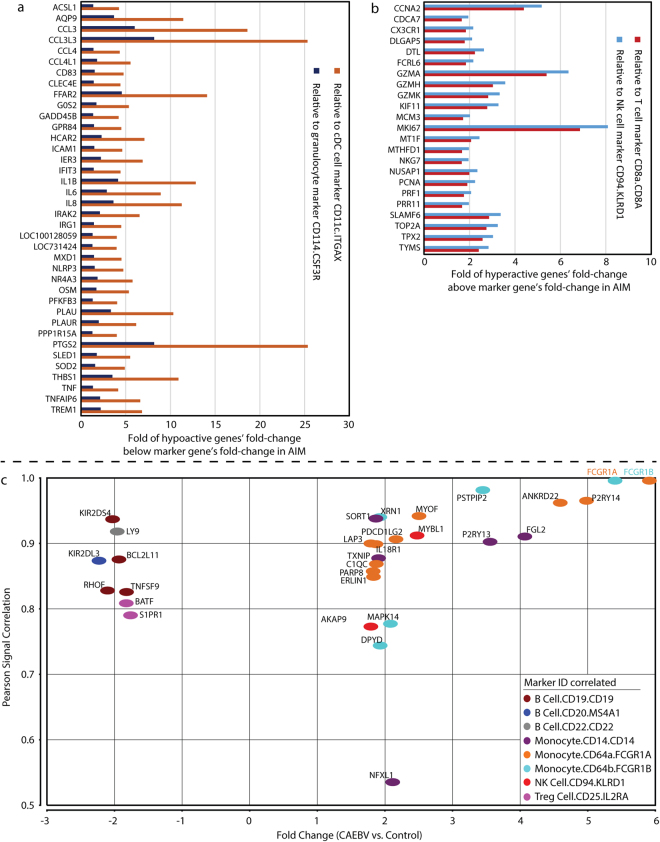
Figure 5.
Key genes defined through whole transcriptome profiling analysis. (a) Hypoactive and (b) hyperactive genes identified in patients with acute EBV infection (AIM) in our primary cohort. The expression levels of the 61 genes were highly correlated with those of blood immune cell markers at Pearson correlation coefficient >= 0.8 and their fold-changes were at least 1.5 fold below (panel A: hypoactive) or above (panel B: hyperactive) the fold-changes of a cell marker gene. The model cell markers (CD11c, CD114, CD8a, and CD94) were selected based upon the level of their overall correlation with individual genes. (c) Unique dysregulated genes (n = 102) in chronic active EBV infection (CAEBV). These genes were differentially expressed in CAEBV but not in AIM. There were 30 protein coding genes with absolute fold-change values greater than 1.75 at adjusted p < 0.05. Most of these up-regulated genes (15/22) were highly correlated with monocyte markers CD64A/B (FCGR1A/B) and CD14. Most of down-regulated genes (6/8) were correlated with EBV targeting B cell markers CD19/20/22.

