Figure 7.
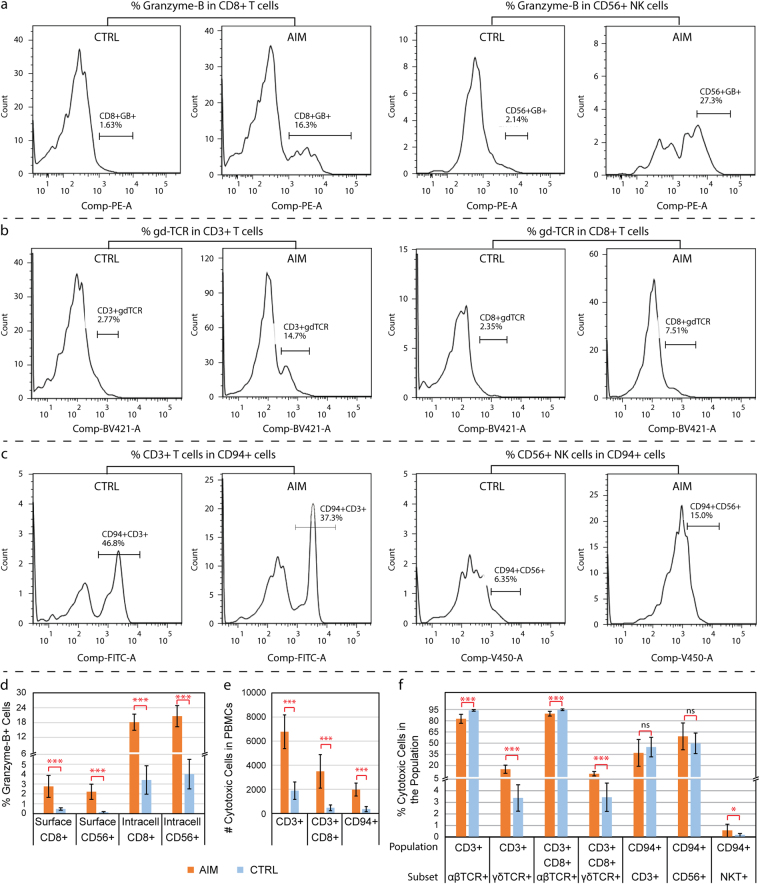
Data from the validation flow cytometry assays. Panels (a–c) show representative flow cytometry blots from experiments for frequencies of Granzyme-B, γδ TCR (gdTCR), and CD94-expressing cytotoxic cells. Panels (d–f) present the results summary from the flow cytometry analyses with statistics. Each bar represents the mean and standard deviation of the data for each cell population. (d) Percent of intracellular or surface granzyme-B + cells in the pools of CD3+ CD8+ and CD56+ cell populations from 8–10 subjects with acute infectious mononucleosis (AIM) and 10–15 healthy controls (CTRL) in the secondary cohort. (e) Number of cytotoxic cells in 10,000 PBMCs from 10 patients with AIM and 10 healthy controls. (f) Percent of cytotoxic cells in a specific cell population from the same cohort of 10 AIM and 10 healthy control subjects. Mann-Whitney U test was performed and the significant difference was marked with *(p < 0.05), ***(p < 0.001) and ns for no significance (p > 0.2) between AIM vs. CTRL.

