Figure 2.
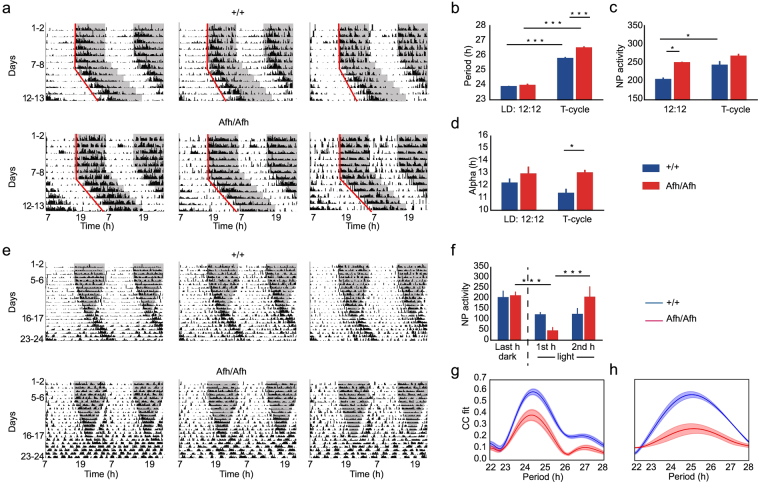
T-cycle and dark phase reduction reveals lack of phenotypic plasticity in circadian behavior in Afh mutants. Representative double-plotted actograms of nose poking activity for three wild-type (upper panels) and three Afh (lower panels) mice (a). Nose pokes were collected in 15 minutes bins and plotted as black bars. Dark phase is marked with a shaded region in both 12:12 light dark schedule and T-cycle. Mean + SEM of period (b), nose pokes (c) and alpha phase (d) are presented for LD and T-cycle conditions. Blue bars are for wild-type mice (n = 6) and red bars for Afh (n = 6) homozygous mutants. Examples of double-plotted actograms for wild-type (upper panels) and Afh (lower panels) mice (e). Dark phase is marked with a shaded region. Fixed LD 12:12 schedule runs is shown for 5–6 days, then all mice undergo a progressive reduction of the dark phase over 12 days. In particular, each consecutive dark phase during these 12 days is reduced by an hour (30 minutes at the beginning and 30 minutes at the end of the dark phase). (f) Mean + SEM of nose poke activity during last hour of the dark phase and the first two hours of the light phase are presented for wild-type mice in blue and for Afh in red. Pearson Correlation coefficient between a fitted sinusoidal curve and nose poke activity for a range of periodicities varying between 22 and 28 hours during dark phase reduction (g) and constant light (h) phase. Solid lines represent mean and shaded regions represent mean ± SEM. Blue lines are always associated with wild-type and red with Afh. *p < 0.05, ***p < 0.001, two way ANOVA with repeated measure post hoc test, Bonferroni corrected.

