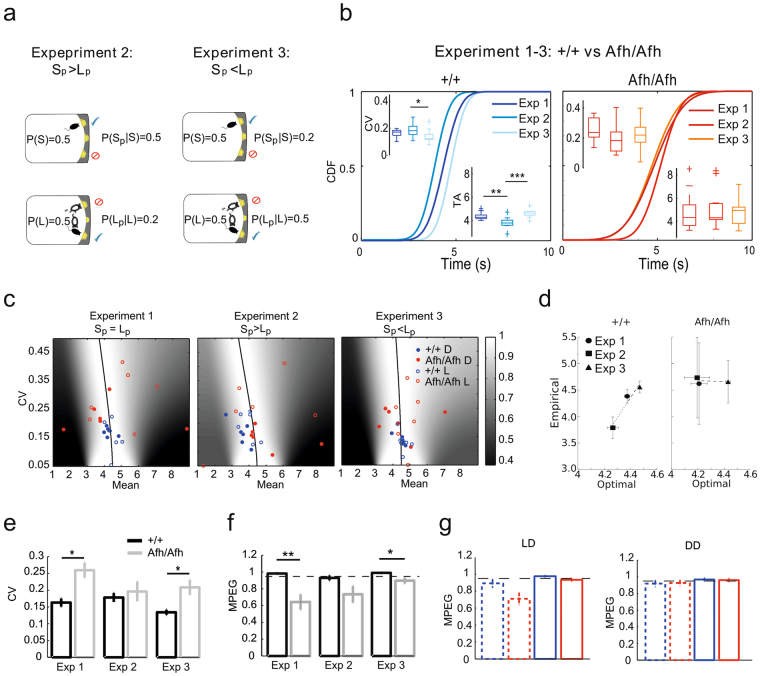
Figure 6.
Probabilities and optimal decision-making: Afh mutants do not exhibit behavioral flexibility and make suboptimal decisions. Graphical representation of different experiments (Experiment 2 and 3) during switch task in which the probabilities of obtaining probe trials changed at short (Sp) and long (Lp) locations (a). Experiment 1 is shown in Fig. 5a. Comparison between the CDFs of the switch latencies during the three phases for each genotype (n = 6 wild-types; n = 6 Afh homozygous mice). The boxplots of the timing uncertainty (i.e., CV) and timing accuracy (TA) are shown above and below the cumulative curves. (Paired t-test within genotype, *p < 0.05, **p < 0.005, ***p < 0.001) (b). The three panels represent the expected gain surface for the three experimental conditions and the associated optimal performance curves (black solid line). We then plotted over the expected gain surfaces the empirical mean switch latency of each mouse separating them by their genotypes, in dark (filled circle) and in light (empty circle) phase (c). The empirical switch latencies as a function of optimal latencies in wild-type mice (left panel) and Afh mutants (right panel) for three experimental conditions (d). Timing uncertainty (i.e., CV) for each genotype and each experimental phase (e). Proportion of maximum possible expected gain (MPEG) in the three experimental conditions (f) as well as in LD (left panel) and DD (right panel) for Experiment 1 (g). Homozygous mice never reached the optimality (black dashed lines; values >0.95; *p < 0.05, **p < 0.005, One-way ANOVA). MPEG values are plotted per genotype (i.e., grey or red = Afh; black or blue = control mice) and phase (light/subjective day are the dashed lines; dark/subjective night solid lines).

