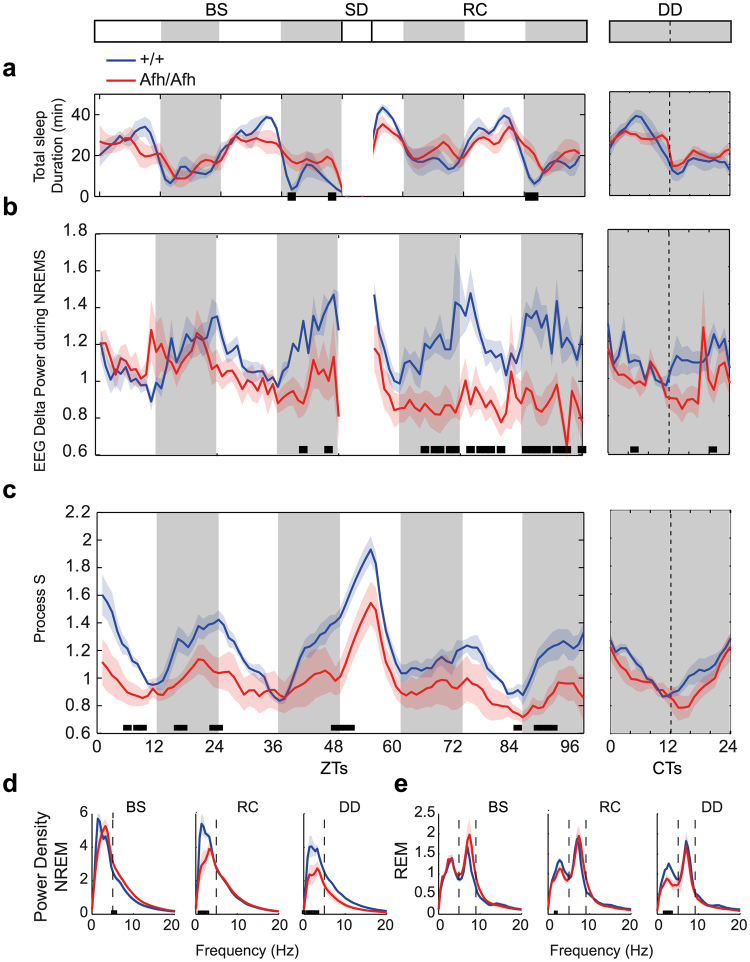
Figure 7.
Afh mutants show disrupted sleep homeostasis. (a) Total sleep time in baseline (BS) and recovery (RC) period after sleep deprivation (SD) and in constant darkness (DD). (b) EEG delta power during NREM epochs is plotted for all phases. (c) Process S across all phases. Power density values for the entire BS, RC and DD phases are presented for NREM (d) and REM (e) epochs. All graphs are presented as mean ± SEM over either 1 hour intervals (a–c) or as frequencies (d,e). The black bars at the bottom of each graph indicate intervals where significant genotype differences were identified (n = 6 wild-types; n = 6 Afh mutants; P < 0.05, One-way ANOVA). The gray shadowed regions represent the dark phases. All graphs in DD are presented as CTs where data are rescaled according to subjective periodicities (see Methods).

