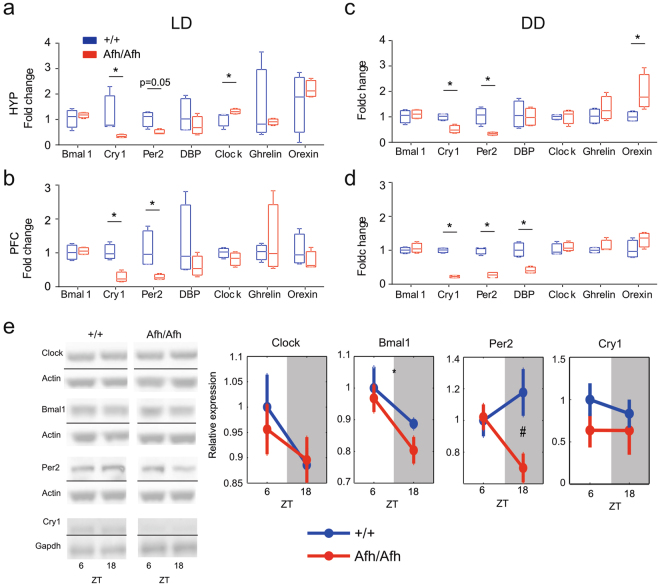
Figure 8.
Clock molecular targets are abnormally expressed in Afh mutants in brain areas outside the SCN. Gene expression of clock and clock-related genes plotted for HYP and PFC in LD (a,b) and in DD (c,d). The asterisks above the graph indicate significant genotype differences (n = 4 wild-types; n = 4 Afh mutants; P < 0.05, One-way ANOVA). (e) Clock proteins in Striatum. Levels of clock proteins are shown at ZT6 and ZT18. Grey shadowed regions represent the dark phase (right panels). The (*) mark indicates significant effects of time while the (#) mark indicates significant genotype effects (n = 8 wild-types; n = 8 Afh mutants).

