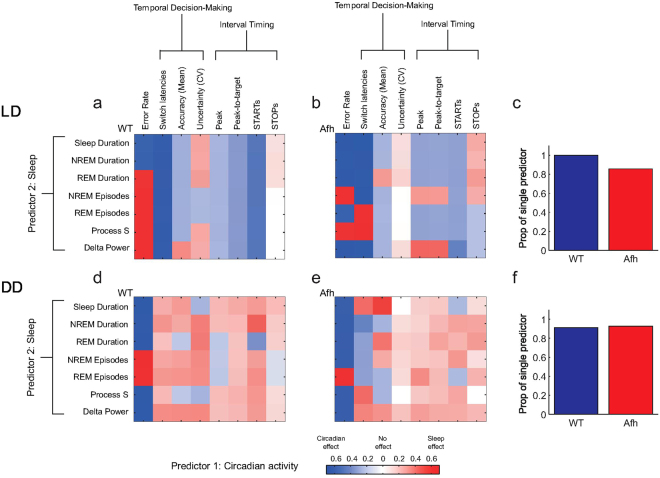
Figure 9.
Multiple regression analysis (MRA) for circadian and sleep predictors over behavioral measures. MRAs are plotted for multiple behaviors in LD (upper panels, (a,b)) and DD (lower panels, (d,e)) and for wild-type (left panels, (a,d)) mice and Afh (right panels, (b,e)) mutants. Predictor 1 (circadian nose poking activity) and different sleep measures as predictor 2 were used. The color intensity reflects the R2 value of MRA corresponding to the best lag condition. The proportion of MRAs in which a single regressor was needed to predict the behavior in LD (c) and DD (f) condition.

