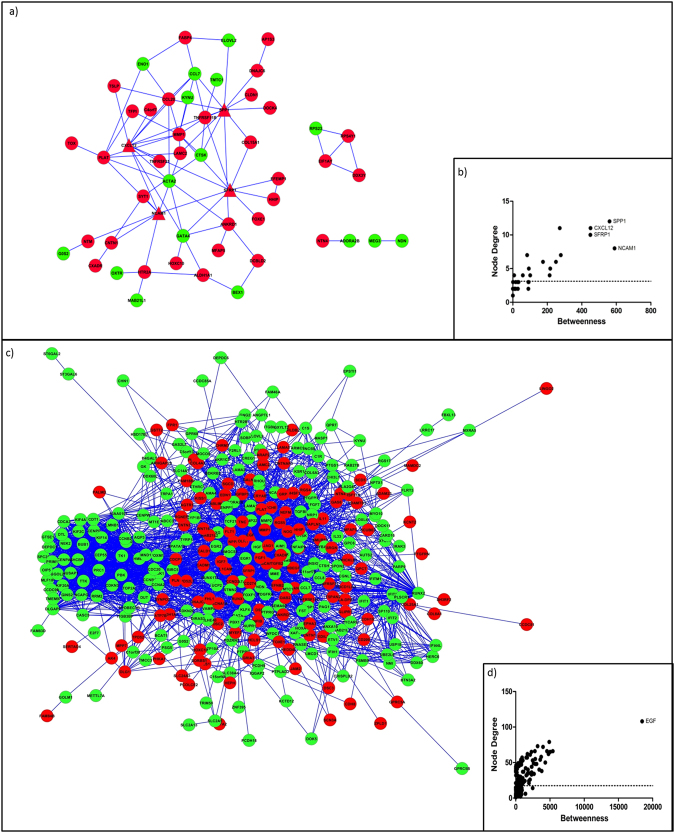
Figure 5.
Networks of the DEGs in hMSCs/inv. (a) Network of the DEGs in young hMSCs/inv compared with young hMSCs/n. (b) SPP1, CXCL12, SFRP1, and NCAM1 are the triangle nodes identified as bottlenecks. (c) Network of the DEGs in senescent hMSCs/inv compared with senescent hMSCs/n. (d) EGF is the triangle node identified as a bottleneck. The red and green colors represent upregulated and downregulated genes in hMSC/inv, respectively.

