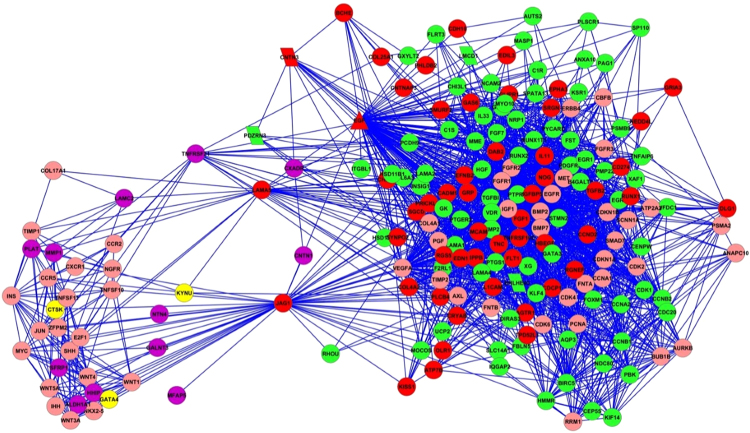
Figure 6.
Networks of the common DEGs between young hMSCs/inv vs. hMSCs/n and senescent hMSCs/inv vs. hMSCs/n. The red and green colors represent upregulated and downregulated genes in senescent hMSCs/inv compared with senescent hMSCs/n, respectively. The purple and yellow colors represent upregulated and downregulated genes in young hMSCs/inv compared with hMSCs/n, respectively. The pink color represents genes from the human genome databases that are connected with genes that did not show expression changes. TNFRSF21, LAMA5, and JAG1 are the triangle nodes identified as hubs connected with the bottleneck EGF. PDZRN3 and CNTN3 are parallelogram nodes localized in the region of the chromosomal inversion of hMSCs/inv.

