
Fig. 2.
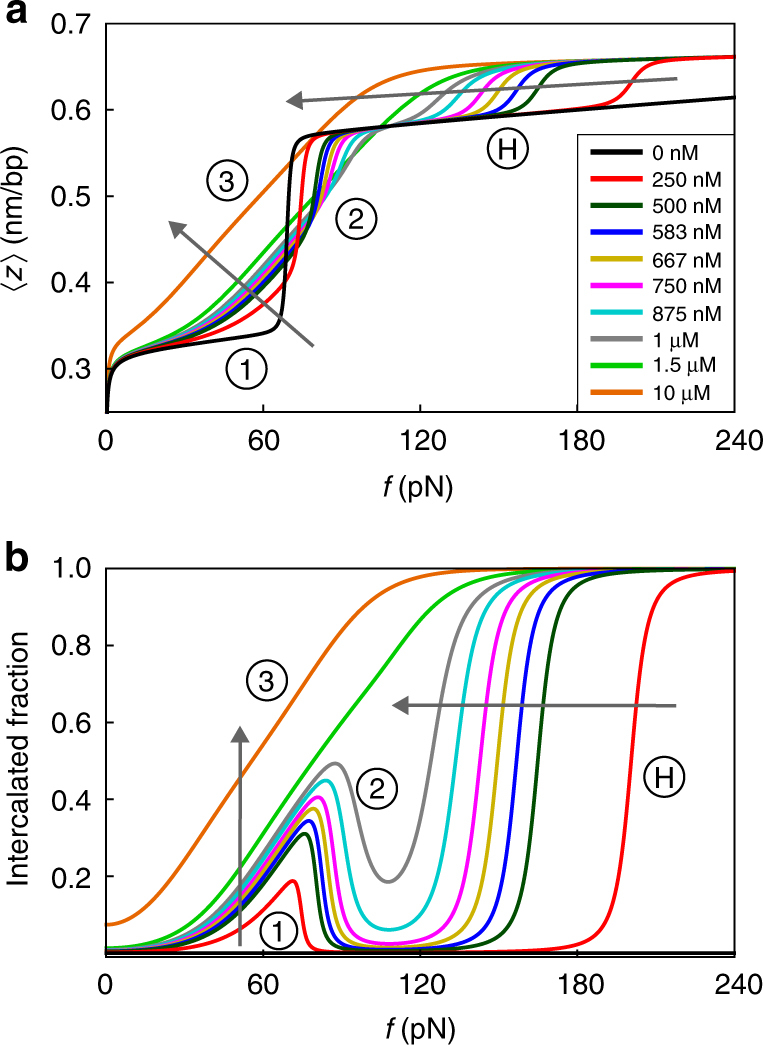
Theoretical curves of the DNA extension per base pair (a) and fraction of intercalator-bound base pairs (b) as a function of the applied force for intercalator concentrations C that match the experimental ones of Fig. 1. The arrows indicate the direction of increasing concentration. The model parameters, obtained from a fitting procedure, are discussed in Supplementary Note 1. The features 1, 2 and 3 and the prediction H are discussed in the main text