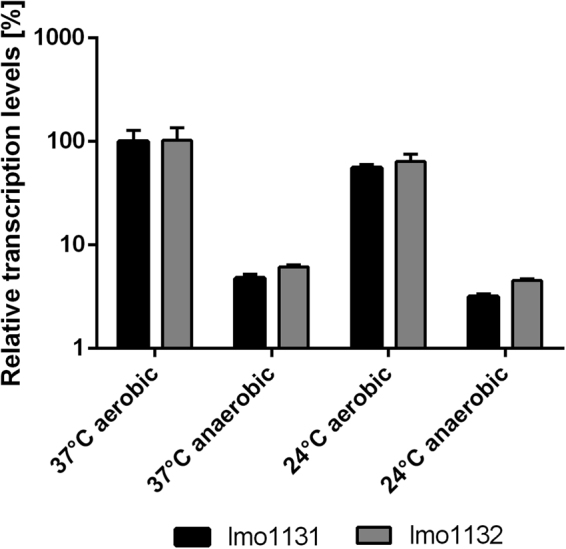
Figure 3.

Temperature- and oxygen-dependent transcription of lmo1131 and lmo1132. Relative transcription of genes lmo1131 (black bars) and lmo1132 (gray bars) for the conditions 37 °C anaerobic, 24 °C aerobic, and 24 °C anaerobic was compared to that at 37 °C aerobic (preassigned as 100% gene expression for lmo1131). The results were calculated using the 2−ΔΔCT method95 and lmo1759 (pcrA) was used as a reference gene for normalization. Error bars indicate the standard error of three biologically independent experiments including technical duplicates for each condition.
