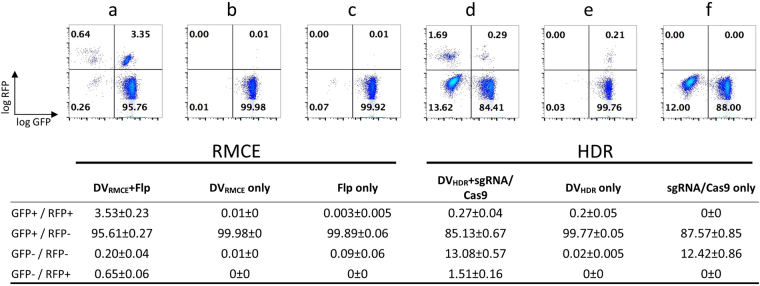
Figure 6.
Side-by-side comparison of RMCE and HDR recombination frequencies. Both transgene integration systems targeting the same loci in cell clone CHO.S18 in a side-by-side comparison. The fluorescent marker protein distribution of unselected cell pools 9 days after transfection is shown. Below each plot the plasmids used for transient transfection are listed for both the RMCE and HDR approach. For details of the transfection reactions, see Methods section (summary table: mean ± standard deviation; n = 3).

