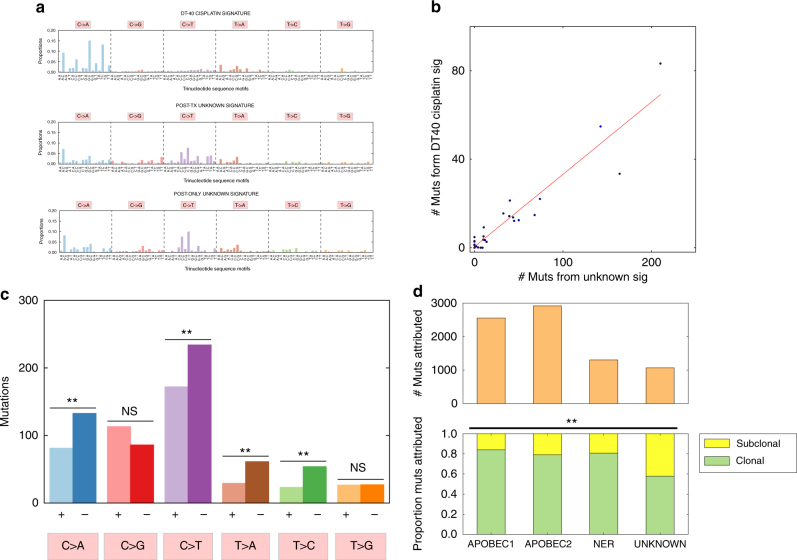
Fig. 3.
Evaluation of a potential cisplatin chemotherapy mutational signature. a Comparison of a chicken lymphoblast (DT40) cisplatin-induced mutational signature and the two unknown signatures found in the post-treatment and post-treatment-only mutational signatures. These are mutations induced in chicken lymphoblast (DT40) cells treated with cisplatin18, adjusted for relative trinucleotide motif frequencies between the chicken and human genomes/exomes. The cos similarity of this signature with the candidate cisplatin signature is modest (0.58), but there are similar T > A motifs (cos sim = 0.87), and the two unknown signatures are similar to each other (cos sim = 0.90). b Correlation between DT40 cisplatin signature activity and the unknown signature activity in the same post-treatment tumors. We replaced the unknown signature with the DT40 cisplatin signature, and inferred its activity (Methods), yielding a Pearson correlation coefficient of 0.948 (p = 0.004 and p = 0.049 for a null distribution of correlations generated by replacing our candidate signature with permutations of the DT40 signature and combinations of COSMIC signatures, respectively (Methods)). cTranscriptional strand bias in the unknown signature. There was evidence of transcription strand bias in C > A (p = 5.8e-04), C > T (p = 0.003), T > A (p = 0.001), and T > C (p = 7.6e-04) (binomial test with null probability = 0.5). A bias against coding (+) strand mutations in C > X and T > X mutations is consistent with transcription coupled repair of platinum crosslinking in the non-coding strand at GpG and ApG motifs, which together represent 90% of crosslinking sites21,22. d Association of the unknown signature with subclonal mutations. We inferred relative proportions of clonal and subclonal mutations in post-treatment tumors attributed to each mutational signature in post-treatment tumors. The unknown signature has greater proportion of subclonal mutations (42%) compared to the overall average (22%) (chi-squared p = 6.2e-68 with DF = 3). N.S. = Not statistically significant; “*”Indicates p < 0.05; “**”Indicates p < 0.01

