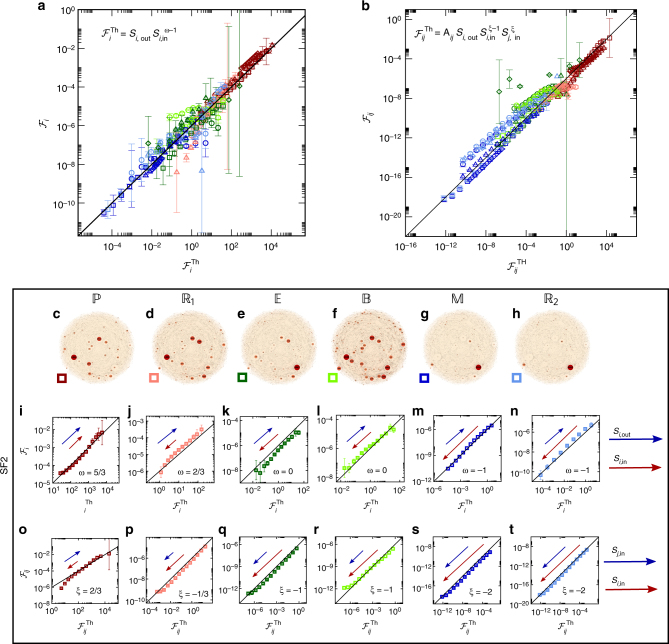
Fig. 3.
Predicting the observed flow patterns. We used Eqs. (6) and (9) to predict the flow of information in the twenty-four systems of Fig. 2, finding that despite their diverse behaviors, they all emerge from these two universal equations. a vs. for all layouts of Fig. 2. As predicted, all flow patterns condense around the single analytically derived function (linear solid line) of (6), with their diversity rooted in the different values of the dynamic exponent ω (8). The color/shape representing each network appears adjacent to the appropriate layout in Fig. 2, e.g., SF1 with dynamics (Fig. 2a) is represented by dark red circles, SF2 with (Fig. 2g)—dark red squares, etc. b vs. , as predicted in (9), for all networks/dynamics of Fig. 2, showing an agreement that spans over sixteen orders of magnitude. c–h Revisiting the flow patterns of the directed scale-free network SF2 (identical to Fig. 2g–l). i–n vs. as extracted from the SF2 layouts shown in c–h. The arrows point in the direction of large S i,in (red) and S i,out (blue). For instance, under dynamics (ω = 5/3) the flow increases with both in/out degrees, hence both arrows point upwards. In contrast for (ω = 2/3), nodes with large S i,in are concentrated at the bottom left, contributing less to the flow. The strength of the effect is captured by the length of the arrow. Equation (6) rearranges the nodes, locating the in-hubs at the high flow limit (top right) or at the low flow limit (bottom left) depending on the value of ω, providing qualitative insight on the characteristics that increase/decrease flow for each type of dynamics. o–t vs. as obtained from SF2. The arrows point in the direction of large S j,in (blue) and S i,in (red). Details on all networks and dynamic simulations are outlined in Supplementary Note 3. Error bars represent 95% confidence intervals (Supplementary Note 3)

