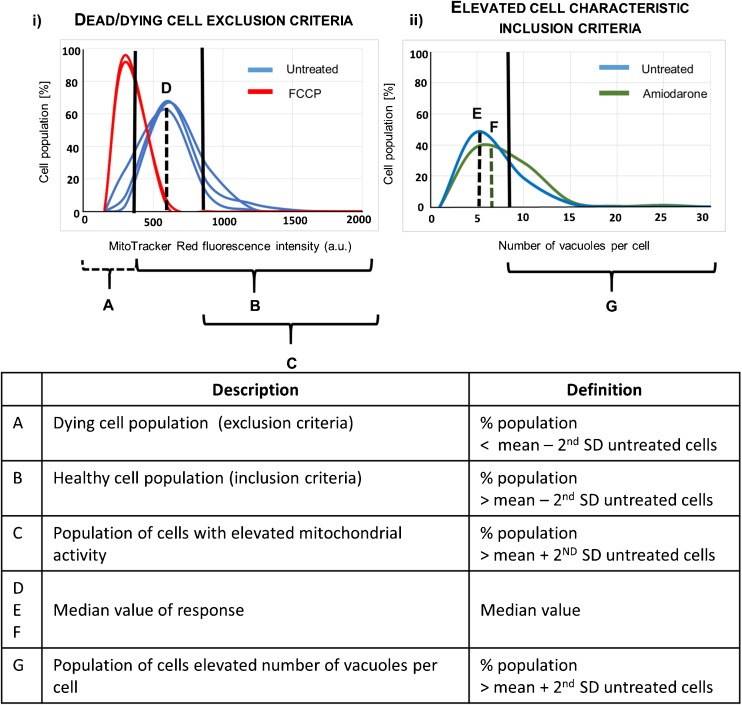
Fig. 1.
Representation of data analysis approach. Single cell data was summarised as a frequency histogram to assess the reproducibility of untreated cells, control treatments and sample treatments (i) Dying cells (defined as the population with a mitochondrial activity < mean value minus 2nd SD) were excluded from the analysis (a), and the remainder of the cell population were included (b). Initial data analysis compared the median response values (d, e, f). Elevated cell responses (c and g) defined as the population of cells with cell characteristic > mean plus the 2nd SD from the untreated cell population were also calculated and data summarised as elevated response profiles (ii).

